Download
1 / 19
190 likes | 195 Vues
This study examines the survival and behavior of juvenile Chinook salmon in the Lower Columbia River, estuary, and plume. The results of the study so far, as well as future directions and management implications, are discussed. The study utilizes JSATS technology to track and monitor the fish.

E N D
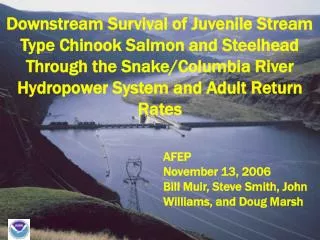
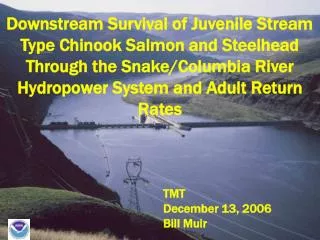
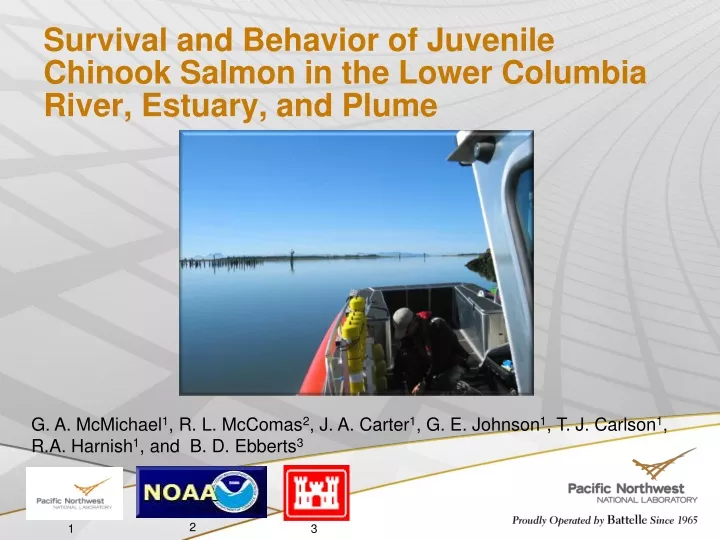
Survival and Behavior of Juvenile Chinook Salmon in the Lower Columbia River, Estuary, and Plume G. A. McMichael1, R. L. McComas2, J. A. Carter1, G. E. Johnson1, T. J. Carlson1, R.A. Harnish1, and B. D. Ebberts3 2 1 3
Outline • Background • JSATS equipment • Summary of results to date • Behavior • Survival • Future direction • Conclusions and management implications
Background • JSATS was developed to estimate survival between Bonneville Dam and the Pacific Ocean • Results from 2005 and 2006 showed higher than expected losses in lower 235 km of CR (up to ~25 to 50%) • For context - min estimates of avian predation ~ 2 to 5% • In 2007 and 2008 the LCR was partitioned into six reaches; found greatest losses in lower 50 km • 2009 added an array at Astoria Bridge (RKM 22) and focused mobile effort (NOAA) to assess fate of fish that cease migration in lower 50 km
JSATS Equipment used in LCR and Estuary • Transmitters • Size • Weight = 0.43 g in air, 0.29 g in water • Length = 12 mm, same as PIT tag • Tag Life • 23 days (3 sec PRI) • 32 days (5 sec PRI) • Range • ~300 m • Receivers • Autonomous • Mobile Tracker
Summary Results- Yearling Chinook Salmon Behavior 2005-2009 • Travel time from Bonneville to East Sand Island averaged less than 4 days – with more variability in 2008 • Fish travel faster later in the season Travel rate from Bonneville Dam to East Sand Island (RKM 236 to 8) (2009)
Summary Results- Yearling Chinook Salmon Behavior 2009 • Fish slow down as they enter the ‘wide part’ of the estuary – until they commit Pacific Ocean Three-tree Point Bonneville Dam Astoria Bridge
Yearling Chinook (2008) 15% 71% 14%
Cross-Channel Distribution - Yearlings % of fish detections % of fish detections
Yearling Chinook Salmon Survival Lowest in Final 50 km of Columbia River Estuary *Minimum loss due to avian predation ~ 2.5% Bonneville Dam *2009 survival estimates are preliminary
Summary Results- Subyearling Chinook Salmon Behavior 2005-2008 • Travel time from Bonneville to the ocean averages 4 to 5 days • Fish travel faster as season progresses – then slow down late (2008)
Summary Results- Subyearling Chinook Salmon Behavior 2008 • Fish slow down as they enter the ‘wide part’ of the estuary Pacific Ocean Bonneville Dam Three-tree Point
Subyearling Chinook (2008) 19% 63% 17%
Cross-Channel Distribution - Subyearlings % of fish detections % of fish detections
Subyearling Chinook Salmon Survival lowest in final 50 km *Minimum loss due to avian predation ~ 4% East Sand Island Bonneville Dam
Subyearling Chinook Salmon – Late groups “survive” poorly East Sand Island Bonneville Dam
2009 Plume Test:3 receivers; 6/23-7/2172 fish Detected • 1 yearling Chinook salmon (JDA Pool) • 6 subyearling Chinook salmon (Grant County) • 65 subyearling Chinook salmon (JDA Pool) • Travel time from JDA Pool to RKM 8 = 7.5 d (±0.20) • 46 km/d • Travel time from RKM 8 to Plume = 1.3 d (±0.26) • 13 km/d
Future Direction • 2010+ Plans • Estuary/Plume work will be closely integrated with BiOp Performance Standards assessments at lower three dams and mobile tracking effort proposed by NOAA • Assess reach survival and behavior, with focus on lower 50 km • Assess LCR/Estuary survival of early vs. late transported groups • Assess passage-route-specific mortality in LCR and Estuary • Collect behavioral data in plume to guide future survival assessment • Increase collaboration with other researchers to address critical uncertainties regarding effects of the FCRPS and habitat mitigation activities on fishes using the LCR and estuary
Conclusions/Management Implications The monitoring capability that has been developed around JSATS technology can be applied and extended to assess the success of FCRPS mitigation strategies and other management actions in the LCR, estuary, and plume. Coordinated/collaborative efforts in 2010+ will take advantage of ~25k JSATS-tagged fish released upstream and present the first opportunity to assess the effects of different FCRPS passage experiences on behavior and survival downstream of the dams Plume tests (2008 and 2009) have been successful and a pilot-scale plume array (20 nodes) is proposed to expand the time/space over which to assess effects of FCRPS mitigation strategies and other estuary management actions on survival to ocean entry
For more information geoffrey.mcmichael@pnl.gov Blaine.D.Ebberts@usace.army.mil www.nwp.army http://jsats.pnl.gov/