Download
1 / 22
220 likes | 319 Vues
Plant Community Analysis. Of the Mitchell Marsh, Salmon River Estuary. Ed Buchner Dept. GeoSciences May 26, 2004. Introduction. What is a Plant Community? Why are they important? How have they been used at this site? What methods of analysis have been used? Importance of visualization

E N D
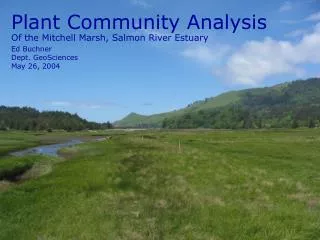
Plant Community Analysis Of the Mitchell Marsh, Salmon River Estuary Ed Buchner Dept. GeoSciences May 26, 2004
Introduction • What is a Plant Community? • Why are they important? • How have they been used at this site? • What methods of analysis have been used? • Importance of visualization • Use of kriging
Study Site • Location
Study Site • Location • Early Uses • Diking • Restoration
Data • Previously Collected • Species percent cover • Biomass • Soil salinity • X,Y location • Elevation • Data used in analysis • Species percent cover • X,Y location
Methods – Plant Community Indicator • Not interested in individual species • Plant community indicator development • NPCI
Methods – Plant Community Indicator • Not interested in individual species • Plant community indicator development • NPCI • Based on NDVI • Band1-Band2/Band1+Band2
Methods – Plant Community Indicator • Not interested in individual species • Plant community indicator development • NPCI • Based on NDVI • Band1-Band2/Band1+Band2 • (CALY+SAVI)-(POPA+JUBA) • CALY = Carex lyngbei • SAVI = Salicornia virginica • POPA = Potentilla pacifica • JUBA = Juncus balticus
Methods – Plant Community Indicator • Not interested in individual species • Plant community indicator development • NPCI • Based on NDVI • PCA • Captures variation with one variable • CALY • SAVI • POPA • JUBA
Methods – Data distribution • Statistical assumptions • Importance of data normality • What is normal • Histogram • Normal QQ
Methods – Data distribution • NPCI and PCA Component 1
Methods – Data Transformation • ArcSIN transformation • Data Caveat • Will this work?
Methods – Kriging • Ordinary Kriging • Prediction map • 1st order trend removal • Anisotropy • Comparison of Indicators • Ground truthing • A priori knowledge
Results – Transformation • Data Transformation PCA Component 1 ArcSIN Transformation
Results – Kriging • NPCI
Results – Kriging • Component 1
Results – Kriging • ArcSIN Transformation
Discussion • Plant Community Indicator • Transformation • Kriging • Alternative Visual Approach
Discussion • Plant Community Indicator • Transformation • Kriging • Alternative Visual Approach
Discussion • Plant Community Indicator • Transformation • Kriging • Alternative Visual Approach
Discussion • Plant Community Indicator • Transformation • Kriging • Alternative Visual Approach