Group Projects Overview for Econ 240a: Analysis & Presentations
This document outlines the collaborative projects for Econ 240a, detailing group assignments, presentation guidelines, and data sources. It includes information about team members and their roles, project objectives, statistical analysis methods, and the requirements for the PowerPoint presentations, executive summaries, and technical appendices. Essential data sources such as FRED, Economagic, and the Bureau of Labor Statistics are highlighted, providing a foundation for the research components of the projects. For submission details, please refer to the attached email to Mark Dotson.

Group Projects Overview for Econ 240a: Analysis & Presentations
E N D
Presentation Transcript
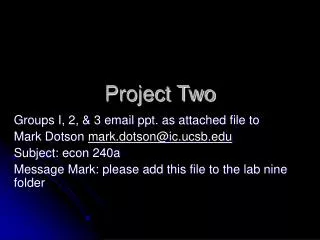
Project Two Groups I, 2, & 3 email ppt. as attached file to Mark Dotson mark.dotson@ic.ucsb.edu Subject: econ 240a Message Mark: please add this file to the lab nine folder
Outline • I. Projects • II. Goodness of Fit & Chi Square
Part I: Projects • Teams • Assignments • Presentations • Data Sources • Grades
Group1 Group 2Group 3 Torbjorn Bjering Aleksander Keyfes Jeff Lee Ho-Jung Hsiao Christopher Stroud Zhen Tian Eric Griffin Visut Hemuthi Tsung-Ching Huang Chun-Hung Lin Marisa Pittman Oystein Tennum Gulsa Guenec Noelle Hirneise Christian Treubig Gaoyuan Tian Lindsey Aspel Edmund Bedach Laura Braeutigan Group 4Group 5Group 6 Julianne Shan Yao Wang Matthew Mullens Brian Abe Brooks Allen Chungkai Gao Yu-Ting Cheng Morgan Hansen Eric Wright Kathinka Tysnes Yuli Yan Tore Bjoendal Huan Zhang Ting Zheng Daniel Helling Andrew Booth Uthra Radhakrishnan Chien-Ju Lin
Team One • : Project choice • : Data Retrieval • : Statistical Analysis • : PowerPoint Presentation • : Executive Summary • : Technical Appendix • : Graphics (Excel, Eviews, other)
Assignments • 1. Project choice: • 2. Data Retrieval: • 3. Statistical Analysis: • 4. PowerPoint Presentation: • 5. Executive Summary: • 6. Technical Appendix: • 7. Graphics:
PowerPoint Presentations: Member 4 • 1. Introduction: Members 1 ,2 , 3 • What • Why • How • 2. Executive Summary: Member 5 • 3. Exploratory Data Analysis: Members 3, 7 • 4. Descriptive Statistics: Member 3, 7 • 5. Statistical Analysis: Member 3 • 6. Conclusions: Members 3 & 5 • 7. Technical Appendix: Table of Contents, Member 6
Data Sources • FRED: Federal Reserve Bank of St. Louis, http://research.stlouisfed.org/fred/ • Business/Fiscal • Index of Consumer Sentiment, Monthly (1952:11) • Light Weight Vehicle Sales, Auto and Light Truck, Monthly (1976.01) • Economagic, http://www.economagic.com/ • U S Dept. of Commerce, http://www.commerce.gov/ • Population • Economic Analysis, http://www.bea.gov/
Data Sources (Cont. ) • Bureau of Labor Statistics, http://stats.bls.gov/ • California Dept of Finance, http://www.dof.ca.gov/