Uncertainty & Decision Making
Uncertainty & Decision Making. James K. Hammitt Harvard Center for Risk Analysis. Outline. Uncertainty aversion & value of information Representing uncertainty as probability Policy evaluation Components of uncertainty Examples Diesel-vehicle emissions Mercury from power plants

Uncertainty & Decision Making
E N D
Presentation Transcript
Uncertainty & Decision Making James K. Hammitt Harvard Center for Risk Analysis
Outline • Uncertainty aversion & value of information • Representing uncertainty as probability • Policy evaluation • Components of uncertainty • Examples • Diesel-vehicle emissions • Mercury from power plants • Expert judgment
Aversion to Risk, Uncertainty, Ambiguity, & Ignorance • Humans dislike absence of certainty • Risk: "objective" probabilities • Uncertainty: subjective probabilities • Ambiguity: unknown probabilities • Ignorance: unknown possible outcomes • Should we take greater precaution when risks are more uncertain? • How should we describe uncertainty?
Perils of Prudence(Nichols & Zeckhauser 1986) • Conservative assumptions, worst-case analysis, uncertainty aversion can increase harm • Technology Deaths Probability Expected deaths • Uncertain 1 0.99 • 1,000 0.01 11 • Certain 101 1.0 101 • Using upper-bound risk estimates, Certain would be preferred to Uncertain
Perils of Prudence • If decision is repeated for 10 pairs of technologies (and risks are independent) • Technology Deaths Probability • Uncertain 10 0.904 • < 1,010 0.996 • Certain 1, 010 1.0 • Policy of choosing Certain (with smaller upper-bound risk) is almost sure to kill more people
Value of Information • For each of 10 technologies, learn true number of deaths for ambiguous type • Choose Uncertain if it causes 1 death • Choose Certain otherwise • Choice Expected deaths • Uncertain (always) 110 • Certain (always) 1,010 • Perfect information 20 • Expected value of information 90 lives saved
Value(s) of Information • Increase chance of choosing decision that is best for actual conditions • "Expected value of information" in decision theory • Overcome burden of proof needed to depart from status quo policy or default assumption • Compensate for decision rule that does not maximize expected value of outcome • Reassure decision makers and affected public that decision is appropriate • Enhance compliance, minimize opposition & legal challenges • Incorporate compliance and challenges as factors in analysis?
Quantifying Uncertainty with Probability • Probabilities of health risks are subjective • Often extrapolated from animal experiments or observational human data • Quantitative measure of degree of belief • Individuals can have different probabilities for same event • There is no "true" or "objective" probability • All probabilities are subjective • "Objective randomness" is not random but chaos (e.g., coin toss, roulette wheel) • Deterministic process • Sensitively dependent on initial conditions (butterfly flapping wings in China may cause hurricane in Atlantic) • Insufficient information about initial conditions
Disagreement Among Experts • Individuals can hold different probabilities • When evidence to choose among them is inadequate • As evidence accumulates • Experts should update their probabilities • "When somebody persuades me that I am wrong, I change my mind. What do you do?" - John Maynard Keynes • Ultimately, probabilities should converge • Coin toss, roulette wheel • "In the long run we are all dead."- John Maynard Keynes
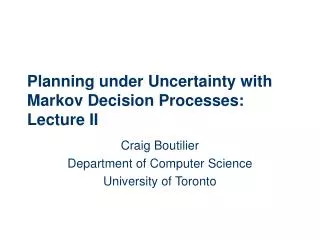
Quantifying Uncertainty About Policy Outcomes • Use simulation model to combine multiple inputs • Inputs: releases to environment, fate & transport, human exposure, dose-response function • Outputs: adverse health events, benefits and costs • Represent uncertainty about each component of model as probability distribution • Calculate probability distribution of output using Monte Carlo analysis (or alternatives)
Components of Uncertainty • "Model uncertainty" • Functional form • Causality • "Parameter uncertainty" • Sampling variation in data (estimation error) • Relevance of data to application • May be helpful to distinguish, but can combine using "super-model" • Weighted sum of alternative models, weights are uncertain parameters • Note: statistical confidence intervals are not sufficient; exclude many important sources of uncertainty
Example: Low-Dose Extrapolation • Estimate risk at high dose, where risk is measurable (e.g., 1/10, 1/100) • Extrapolate to risk at low dose • Extrapolation can be sensitive to choice among models that fit observed data equally well
10-2 0.5 Dose Response Low Dose Extrapolation 10-5 Probability of Response Excess Risk 0.25 10-8 X M WL, G P 0 10-6 10-2 102 0 75 150 Dose d (ppm) X – Linear Extrapolation L – Logit Model M – Multi-Stage Model G – Gamma Multi-Hit Model W – Weibull Model P – Probit Model Low-dose extrapolation for 2-acetylaminofluorene under several mathematical models.
Policy-Evaluation Examples • Retrofit diesel trucks & buses in Mexico City • Benefits of reducing mercury emissions from electric power plants
Primary PM • SO2 • HC • Primary PM • Ammonium Sulfate • Secondary Organic PM • Death • Catalyzed DPF • Self-Regenerating DPF • Removable DPF • DOC • Capital • O/M • Inspection Diesel Retrofit: Benefit-Cost Model
Annual Deaths Averted (per 1000 vehicles) (Error bars show interquartile range)
Net Benefits of Catalyzed Filter v. Alternatives (US$ millions per 1000 vehicles, model year ≥ 1994)
Relative importance of uncertainty about variables (Interquartile range, annual net benefits of retrofitting all vehicles with active regeneration filters holding other variables fixed at medians)
Mercury from Power Plants Emissions Deposition Fate & Bioaccumulation IQ loss? Heart attack? Exposure
Relative importance of uncertainty about variables(Correlation of input and output)
Expert Judgment • Risk assessment models incorporate many assumptions • Choices usually made by modelers, informed by scientific literature • Meta-analysis can be used when literature is rich • Alternative (or complement): expert elicitation • Experts provide probability distributions for key parameters • Rigorous, replicable process • Selection of experts • Preparation • Interview
Key ElicitationQuestion (Mortality Effect of PM2.5) "What is your estimate of the true percent change in annual, all-cause mortality in the adult U.S. population resulting from a permanent 1µg/m3 reduction in annual average PM2.5" 5th, 25th, 50th, 75th, and 95th percentiles of cumulative density function
Performance: Expert Predictions of Ambient Benzene Concentrations NHEXAS Result Means 90th Percentiles Source: Walker et al. 2003
Conclusions • Outcomes of any policy alternative are uncertain ex ante • Characterize uncertainty as probability distributions • Propagate uncertainties about model inputs using Monte Carlo analysis • Agreement on probabilities may not exist • Pattern of precautionary policies may be costly