Download

1 / 13
130 likes | 204 Vues
Review of 2005 Convection Products at the AWC & Probabilistic CCFP Experiments. Presentation discusses historical comparisons, monthly accuracy scores, consistency, and goals for future improvements in operational forecasts. Explore the development of probabilistic forecast contours and grids to enhance decision-making and reliability. Future work includes improving graph-to-grid conversion, workstation efficiency, user engagement, and legacy product derivation.

E N D
Strategic Convection Products at the AWC- Review of 2005- P/CCFP experiments Presentation to Friends & Partners of Aviation Weather Jack May, Director Aviation Weather Center November 11, 2005
CCFP Review for 2005 • Thanks to Jennifer Mahoney, Stacey Seseske, Mike Kay, and Sean Madine Forecast Verification Section Global Systems Division Earth Systems Research Laboratory
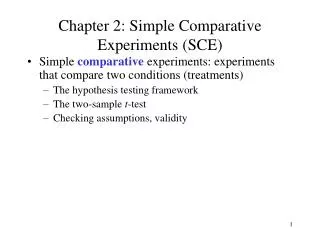
CCFP 2005Accuracy (PODy) & Bias Review FCST FCST FCST OBS OBS OBS PODy 0.0 Bias 1.0 PODy 1.0 Bias 4.0 PODy 1.0 Bias 1.0
Historical Comparison (2001-2005) Figure 3. Monthly averaged PODy scores for convective seasons 2001 through 2005. Scores are from verification of CCFP with the 40-km NCWD. Inset shows the monthly convection (averaged 2001-2005) as percent coverage over the CONUS.
Historical comparison (2004 vs. 2005) Figure 8. Monthly averaged bias scores for convective seasons 2001 through 2005. Scores are from verification of CCFP with the 40-km NCWD. Inset shows the monthly convection (averaged 2001-2005) as percent coverage over the CONUS.
Consistency Figure 9. Monthly time series of 2004 and 2005 consistency scores and the corresponding percentiles. http://www-ad.fsl.noaa.gov/fvb/publications/articles/kay_consistency_ARAM2004.pdf
Figure 12. The frequency of different combinations of coverage and confidence attributes of CCFP polygons issued over the period 3 April – 1 October 2005. For all lead times combined.
Probabilistic CCFP Experiment Goals • Give decision tool developers gridded forecasts on an operational basis while providing legacy product. • Determine workstation enhancements needed to produce probabilistic forecast contours and grids in time allotted. • Help user community to define ‘probability of WHAT?’ • Allow users to view probabilistic CCFP contours and evaluate potential utility. • Help forecasters ‘tune’ their probabilistic forecasts through verification. • Increase reliability and accuracy
Future P-CCFP Work • FY2006 • Improve Graph-to-Grid conversion (e.g., better identification of min and max) • Improve efficiency of workstation contour construction on workstation. • Get Users into the discussion: “Probability of WHAT?” and relevance of P-CCFP. • How best to construct and display flight level & storm top information? • Another experiment. • FY2007/08 (pending funding) • How to best to collaborate contours? • Derive legacy CCFP from probability contours. • Develop verification information for tool makers and producers. • Operational Test and Evaluation