Perception Principles: Message Design Variables
Perception Principles: Message Design Variables. Presented by: Ninette Colburn Jeremy Evans Rebecca Li. Perception of Pictures Perception of Diagrams, Charts, and Graphs Perception of Text Illustration and Text Together Perception of Sounds Researcher Profiles.

Perception Principles: Message Design Variables
E N D
Presentation Transcript
Perception Principles: Message Design Variables Presented by: Ninette Colburn Jeremy Evans Rebecca Li • Perception of Pictures • Perception of Diagrams, Charts, and Graphs • Perception of Text • Illustration and Text Together • Perception of Sounds • Researcher Profiles Whenever you see the pumpkin symbol , raise your hand and answer a question for a treat!
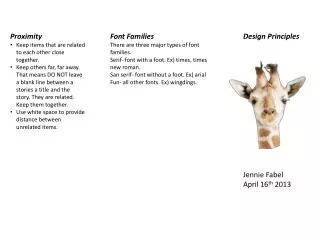
I. Perception of Pictures Home • Pictures are usually more memorable than words • Know what a picture’s function is intended to be before it is designed • Specific instructions are needed as to how to look at and interpret a picture • Decorative pictures should be used sparingly • Organizational pictures should incorporate devices that stress temporal and spatial relationships • Interpretative pictures should be simplified and labeled for immediate accessibility to perception • Transformational pictures should be sufficiently realistic to be memorable • Color serves two purposes: illustrate colors in the real world and draw attention to message features
II. Perception of Diagrams, Charts, and Graphs Home • Diagrams, charts, and graphs may be used in metaphorical ways to make abstract ideas more concrete and easier to grasp • Location of elements in relation to each other helps in the processing of charts and diagrams • Increasing the discriminability of elements in a chart or diagram can reduce the perception of the overall pattern illustrated • Graphic techniques influence perception and interpretation • Relative position of elements to each other is important • Interpretation of graphs is based on a number of mathematical conventions
III.Perception of Text Home • The perception of text is in common with other forms of illustration • Attention is drawn to words or passages that stand in contrast • The way blocks of text are laid out serves as a way to organize the ideas • Ease of readability is affected by type size, line length, amount of space between lines, color and illumination • Less text should be displayed on a computer screen with easy “paging”. • Broad, shallow menu structures are more useful
III. Perception of Text Home • The perception of text is in common with other forms of illustration • Attention is drawn to words or passages that stand in contrast • The way blocks of text are laid out serves as a way to organize the ideas • Ease of readability is affected by type size, • line length, • amount of space between lines, • color and illumination • Less text should be displayed on a computer screen with easy “paging”. • Broad, shallow menu structures are more useful
IV. Illustration and Text Together Home • Illustrations help in reading to learn, not learning to read • Illustrations need to be closely related to the text’s content • The degree to which illustrations facilitate the comprehension of text is the result of the type of illustration, the outcome intended and the student’s characteristics • Illustrations bring about the greatest text comprehension when they represent content that is spatial • Illustrations are least useful with content which can readily create mental images
V. Perception of Sounds Home • Sounds are organized, in time, in ways analogous to the organization of illustrations and text in space • Speech is effective in communicating ideas that have to be understood in a particular sequence • Speech is ephemeral • Text is more effective than speech when the content is complex and visuals are not available • Human speech is the most powerful and expressive medium • When narration accompanies a message in another modality, the relationships between the two messages must be apparent
V. Perception of Sounds Home • Sounds are organized, in time, in ways analogous to the organization of illustrations and text in space • Speech is effective in communicating ideas that have to be understood in a particular sequence • Speech is ephemeral • Text is more effective than speech when the content is complex and visuals are not available • Human speech is the most powerful and expressive medium • When narration accompanies a message in another modality, the relationships between the two messages must be apparent
VI. Researcher Profiles Home • Education: • Ph.D., Educational Technology Arizona State University, Tempe, AZ 85287 (August, 1981) • M.S., Psychology (Educational/School) Fort Hays State University, Hays, KS 67601 (August, 1974) • B.S., Psychology (Education Minor) Fort Hays State University, Hays, KS 67601 (May, 1972 • Experience: • UNIVERSITY OF GEORGIA (Summer,1995-present) • CHARLES H. WHEATLEY-GEORGIA RESEARCH ALLIANCE EMINENT SCHOLAROF TECHNOLOGY-ENHANCED LEARNING; PROFESSOR, Department of Instructional Technology, and DIRECTOR, Learning and Performance Support Laboratory. • FLORIDA STATE UNIVERSITY (1989-summer,1995) • According to Dr. Michael Hannafin, “I presently study the nature and structures related to learner-centered open-ended learning environments, including the cognitive processes associated with their use, the structures of such systems, and the nature of the tools and resources provided through them.” Michael Hannafin, Ph.D. 611 Aderhold HallAthens, GA 30602(706) 542-3157Internet: HANNAFIN@COE.UGA.EDU
VI. Researcher Profiles Home • Gestalt Theory (Wertheimer) • Wertheimer's discovery (1910–12) of the phi phenomenon (concerning the illusion of motion) gave rise to the influential school of Gestalt psychology • His early experiments, in collaboration with Wolfgang Köhler and Kurt Koffka, introduced a new approach (macroscopic as opposed to microscopic) to the study of psychological problems • In the latter part of his life he directed much of his attention to the problem of learning; this research resulted in a book, posthumously published, called Productive Thinking "The basic thesis of gestalt theory might be formulated thus: there are contexts in which what is happening in the whole cannot be deduced from the characteristics of the separate pieces, but conversely; what happens to a part of the whole is, in clearcut cases, determined by the laws of the inner structure of its whole."
VI. Researcher Profiles Home David H. Jonassen http://tiger.coe.missouri.edu/%7Ejonassen/ Biography Doctor of Education, Educational Media/Educational Psychology, 1976 Temple University Currently Dr. Jonassen is a distinguished professor at the University of Missouri. Author of 23 books and numerous articles, chapters, reports ect. Coined the term “mindtools.” Contribution Mindtools – a way of using a computer application program to engage learners in constructive, higher-order, critical thinking about the subjects they are studying (Jonassen). Examples: • Databases • Spreadsheets • Semantic Networks (concept maps) Mindtools are used to generate independent critical thoughts from the user (students) when working with computers. Rather than single button pressing for correct responses, or instructor driven answers, the user works in application programs that force them to learn and think in a non-linear fashion (the way the brain usually operates).
Questions & Answers What type of pictures should be used sparingly? Decorative pictures with no content or purpose Continue Hint
Questions & Answers What two purposes are served by colors in pictures? Illustrate colors in the real world & emphasize a message Continue Hint
Questions & Answers Name one characteristic of using diagrams and charts that helps with the processing of information. Possible answers: location, graphical design, metaphorical connection Continue Hint
Questions & Answers Why would a line graph be used instead of a bar graph? Line graphs show trends over time whereas bar graphs are used to compare information Continue Hint
Questions & Answers Describe a difference between using text on a computer compared to printed text. Possible answers: computer text should be less per page, easy “paging”, size consideration, and color consideration Continue Hint
Questions & Answers What type of sound is the most memorable and the most expressive? Human speech Continue Hint
Questions & Answers Name 4 message design variables. Possible answers: Pictures, Graphs, Charts, Diagrams, Text, and Sound Continue Hint