Download
1 / 70
700 likes | 842 Vues
Intersections The Political Economy of Race and Class in the United States. I. Defining Race and Class. A. Little genetic variance exists in humans 1. Why? Bottleneck 100,000 – 200,000 years ago 2. Migration: “The Urge to Merge”

E N D
IntersectionsThe Political Economy of Race and Class in the United States
I. Defining Race and Class A. Little genetic variance exists in humans 1. Why? Bottleneck 100,000 – 200,000 years ago 2. Migration: “The Urge to Merge” 3. Result: We all have about the same set of ancestors in 1000 BC (everyone alive now is descended from everyone alive then, but in different proportions) B. Race not biologically significant On average: Two random people of the SAME race have 90% as many genetic differences as two random people of DIFFERENT races
C. “Race” is a Social Category 1. Nationality as Race: “How the Irish Became White” 2. Ancestry as Race: “One Drop” 3. Multiracial Classification: Breaking Down Categories
D. What is Social Class? • Usual Criteria: Income, Wealth, Power • Prestige occupations • They Pay More • They Require More Education • They Entail More Abstract Thought • They Offer Greater Autonomy
E. Intersectionality • This term refers to ways in which different types of divisions or discrimination may reinforce each other • Example: Race and Class • Racial stereotyping denies economic opportunities lower incomes • People with lower incomes can’t live in nice neighborhoods housing segregation • Poor neighborhoods have more crime racial stereotyping of their residents • Implication: If race and class divisions reinforce each other, tackling one will be difficult without tackling the other
II. Explaining Income Inequality: Intersectionality or Something Else?
1. Name Discrimination • “White” names about 50% more likely to be called for interviews than “Black” names • Sample stereotyped names:
2. Interviewer Bias • Identical qualifications Whites usually hired • Identical statements Whites perceived as less aggressive • Experiments: Interviewer race affects evaluation of qualifications (circumstances vs. personal responsibility)
B. Education1. It matters, but can’t explain whole income gap
2. Domino Effect: College Education Reinforces Class Divisions
1. Recent Growth: A rising tide that lifts some boats faster than others. Why?
2. Comparison: US vs. World • Gini coefficient (a measure of inequality): higher numbers mean more inequality
3. Increasing inequality is relatively new – little change for 35-year period
A. How Do Families Accumulate Wealth? 1. Theory from Classical Economics • Savings, Wise Investment, Hard Work • Life Cycle 2. Institutional Accumulation: Wealth transferred through legal channels • 2/3 of Middle Class Wealth is Home Equity: Homestead Acts, FHA, Home Mortgage Interest Deductions promote this form of wealth
A. How Do Families Accumulate Wealth? 1. Theory from Classical Economics • Savings, Wise Investment, Hard Work • Life Cycle 2. Institutional Accumulation: Wealth transferred through legal channels • 2/3 of Middle Class Wealth is Home Equity: Homestead Acts, FHA, Home Mortgage Interest Deductions promote this form of wealth • Education: Land Grant Colleges, GI Bill, Subsidized Student Loans, “In Vivo” wealth transfers from parents • Retirement Accounts: Federal programs, subsidies, and tax credits for pensions and savings
B. Inheritance and “Sedimentation” Wealth transfers perpetuate “sedimentation” of inequality – implies that historical discrimination creates inequalities that persist even after discrimination ends. Two primary mechanisms: 1. Inheritance • Whites 4 times as likely to Inherit; • Typical Inheritance for Whites=$10,000; African-Americans=$800 2. In Vivo transfers (Down payments; Education and College Tuition) -- Today, most people pass their disposabletangible wealth to their children during life by education expenditures (not by will or inheritance). Other in vivo transfers: • Life insurance • Joint tenancy • Pensions
C. Fragility: Small Assets Dissipate During Recessions • Example: During the 2001 recession and “jobless recovery,” Latino and African-American families lost over one-quarter of their wealth while the wealth of white families grew slowly, 2 percent.
D. Class Mobility in America: Is Inequality the Future? 1. “The high cost of being poor.” Without savings (wealth) or credit (related to wealth and income): • No deposit – Funnels people to rent-by-the-week motels, more expensive than apartments (largely due to food costs) • Higher utility and other deposits • Bank scarcity: Reliance on money orders, check-cashing facilities, payday lenders, pawn shops, rent-to-own furniture and appliances • Higher costs for groceries (no mega-stores), laundry, gas • Car purchases, loans, insurance much higher for poor, even controlling for driving record
2. Intergenerational Mobility a. Definition: Probability children will have different relative income than parents
b. Trend: Shrinking
E. Wealth Gap is Intersectional: Both Class and Race Matter 1. Mobility higher for poor white children than poor African-American children
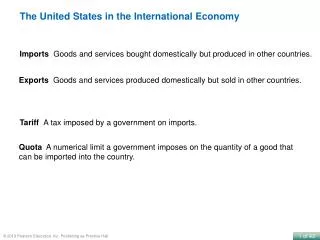
IV. Housing and Spatial Inequality • The spatial inequality thesis: • Social and racial inequities are “geographically inscribed” (correlated with location) • Government policy helps determine geography of inequality (which is not necessarily “natural” or “neutral”) • Implication: Political decisions about housing and land use can increase or decrease both racial and class inequality. As always, politics creates winners and losers…
B. Home Ownership 1. Present-Day Institutional Discrimination: Homeownership and Assets a. Mortgages: Blacks have 60% higher Rejection Rate vs. income/asset-comparable Whites b. Interest Rates: Blacks Pay More (About 1/3 of 1%) • Translates into $12,000 More for Typical Home over 30 years
c. Subprime Loans Racial gap in lending – even wealthy African-American borrowers get high-risk loans
C. “Spatial Racism” -- De Facto Segregation 1. Decreasing but still high 2. More prevalent in North 3. Causes: a. Fragmentation: Smaller school districts and administrative units Milwaukee, the most segregated city in America
b. Government Policy • “Spatial Racism” reinforced by: • Zoning laws prevent affordable housing in many suburbs • Housing policies concentrate subsidized housing • Municipalities subsidize the relocation of businesses out of the city • Transportation spending favors highways, metropolitan expansion and urban sprawl • Court decisions prevent metropolitan school desegregation • School funding is tied to property taxes
Evidence: HDS 2000 Report • 4,600 paired testers, one minority and the other white • Pose as otherwise identical homeseekers and inquire about availability of advertised housing units • Identifying discrimination: • White testers told of available units when African-Americans not told: 12.3% of the time • African-American testers told of available units when Whites not told: 8.3% of the time • Inference: If sample size is large enough, discrimination rate of 4% against African-Americans on this dimension • Many dimensions aggregated together to provide total rate of housing discrimination: whether allowed to inspect apartment/house, quoted rent/price, rent incentives, etc.
Other findings • Systematic “steering” found: Whites likely to be recommended houses in white neighborhoods, minorities in minority neighborhoods (remember, income/employment etc is identical) • Effect is strongest when older agents encountered – consistent with prejudice hypothesis • Interesting: Austin singled out as unusually likely to generate discrimination against both Latinos and African-Americans (only metro area with this “distinction”)
4. Effects of Segregation • Educational inequality: Inter-district busing prohibited • Also reinforces other spatial inequalities (maps them to racial boundaries)
D. Sprawl, Fragmentation and Housing Opportunity for the Poor • Zoning: Suburban regulations drive up the cost of housing and limit rental housing • New housing becomes unaffordable to low income residents • Disinvestment in the inner city reduces the asset value (wealth) of homeowners in inner city neighborhoods
Example: Zoning and Housing Opportunity in Columbus, OH • Suburban lot size requirements in the Columbus suburbs drive up the cost of housing • Result: >90% of new single-family homes built 2000-2002 not affordable to >75% of African American and Latino households
2. “Job Sprawl” Jobs have moved away from the labor pool in many metropolitan areas, making connecting job-seekers with jobs a challenge which is compounded by poor public transportation • 40% of all suburban jobs cannot be reached by public transportation • Public investment disproportionately favors highways over public transportation
Spatial Mismatch:Job Growth & PublicTransit in Baltimore • “Job Sprawl” also correlates with greater segregation for African Americans from employment
E. Opportunity Segregation: Cumulative Impact of Sprawl, Fragmentation and “Spatial Racism” • Low income residents segregated from opportunities such as: • Good schools, meaningful employment, safe and stable neighborhoods • This is “opportunity segregation” • Also reinforces mapping of class and race
V. Political Economy of Criminal Justice: Who Commits the Crime – and Who Does the Time? • Juveniles • Drug dealing: • Use: Hard Drugs