Download
1 / 16
160 likes | 286 Vues
New Analysis of DRE Savings for States & Federal Government. September 22, 2008. Introducing New Analysis of DRE Savings. Conducted by The Lewin Group: Analysis of Drug Rebate Equalization Act’s Savings to the Medicaid Program

E N D
New Analysis of DRE Savings for States & Federal Government September 22, 2008
Introducing New Analysis of DRE Savings • Conducted by The Lewin Group: Analysis of Drug Rebate Equalization Act’s Savings to the Medicaid Program • Accompanying report: Analysis of Dual Eligible Pharmacy Costs Under Medicaid and Medicare Part D
Purpose of Study & Summary Findings 1) Quantify Medicaid savings impacts of DRE • National total and state-by-state savings annually • Five- and ten-year savings, 2009-2018 • State funding and federal government impacts • Bottom Line Finding:DRE would save Medicaid program over $31.4 billion over the upcoming ten years ($17.8 billion savings for Federal government and $13.6 billion for states) 2) Quantify cost impacts of Medicare Part D for dual eligibles • Medicare became primary payer for dual eligibles’ medications as of 2006 • Roughly half of Medicaid beneficiary prescriptions are for dual eligibles • Bottom Line Finding:Part D program increases dual eligibles’ prescription drug costs by $38 billion across first ten years of implementation (2006-2015)
Drug Rebate Equalization Act (DRE) Overview • Title XXI section 1931 mandates rebate payments from drug companies for all Medicaid prescriptions paid for by Medicaid agencies to ensure lowest price (enacted via OBRA 1990) • The catch: Federally-mandated rebates do notapply to Medicaid prescriptions paid for by capitated health plans • The solution: DRE would extend the OBRA ’90 pricing provisions to Medicaid prescriptions paid for by Medicaid health plans as well
Medicaid Drug Rebate Situation Yields 3 options Option #2: Carve-Out Option #3: DRE Option #1: Carve-In
Lewin Methodology • Estimated Medicaid pharmacy costs in base year (2006) for prescriptions utilized by Medicaid health plan enrollees • For carve-in states, estimated savings the DRE would create through more favorable unit prices • For carve-out states, estimated the savings the DRE + carve ins would create through Medicaid health plans’ management of the mix and volume of the pharmacy benefit
Lewin Methodology • Established Baseline Medicaid Pharmacy Costs: • Estimated Medicaid pharmacy costs in 2006 for all capitated Medicaid enrollees were $7.8 billion nationally (after rebates) • $6.1 billion (78% of total costs) occurred in carve-in states; $1.8 billion (22%) in carve-out states
Lewin Methodology – Price Impacts • Price Impacts For Carve-In States: DRE impacts are significant but complex • Health plans pay lower initial (pre-rebate) amounts for drugs than FFS Medicaid programs, due to slightly lower ingredient costs and significantly reduced fill fees • Rebates are significantly larger in Medicaid FFS setting – often averaging more than 30% of initial payments to pharmacy (versus approx. 5% health plan rebates) • Rebate “gap” will be narrowed by health plans because they use more generics (and generics entail smaller percentage rebates than brand drugs) • Net impact of all above factors is a 23.1% savings in Rx spending for capitated enrollees in carve-in states
Lewin Methodology – Usage and Mix Impacts • In carve-out states, Lewin modeled benefits management savings associated with assumed switch to carve-in model • Estimated drug mix savings ranged from 6.4% to 12.7%, depending on FFS brand/generic mix • The greater proportion of generics occurring in FFS, the smaller the impact of the DRE (on drug mix) • 5% savings in Rx volume is projected when carve-out states switch to a carve-in approach (which switches health plan economics from “no-risk” for Rx costs to “full-risk”)
Projected DRE Impacts: Big Dollars!! • Projected Federal Plus State Total Savings Are Significant • Ten-year total Medicaid savings (2009-2018) of $31.4 billion ($17.8 billion in Federal savings and $13.6 billion in state savings) • Five-year total Medicaid savings (2009-2013) of $12.6 billion ($7.1 billion to the federal government and $5.5 to the states)
Projected DRE Impacts: Big News! • Projected state savings are also substantial – no state is adversely affected • Of the 41 states with Medicaid capitation programs, 24 states would realize savings of more than $100 million in state funds across the first ten years of passage of this legislation • Projected sizable DRE savings for carve-out states if they switch to a carve-in model • Carve-out states not switching back to carve in would neither lose nor gain through passage of the DRE
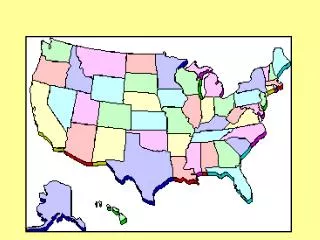
Projected 2009 DRE Related Medicaid Savings State Share in Millions
Projected DRE Impacts: Big News! • Figures shown represent total Medicaid • Savings – Federal and State shares combined
$30 Billion in Savings over Ten Years • SCHIP Reauthorization (H.R. 3963) projected to cost • $37 billion over five years • $75 billion over ten years • Original Offset: Increase in Tobacco Tax • $35 billion over five years • $70 billion over ten years • DRE savings provide substantial offsets • $12.6 billion over five years • $31.4 billion over ten years
Analysis of Dual Eligible Pharmacy Costs Under Medicaid and Medicare Part D • Lewin also evaluated impacts of dual eligibles’ prescription drug spending under Part D • Modeled same components to assess Part D impact on duals: initial ingredient cost, fill fees, rebates, drug mix and prescription volume • Part D increases the government’s prescription drug spending on dual eligibles by $38 billion from 2006 to 2015, an average of nearly $4 billion per year • ACAP bottom line message: for the pharmaceutical industry, any “adverse” impact of the DRE is more than offset by the additional revenues obtained when dual eligibles switched into Part D