Download
1 / 49
510 likes | 633 Vues
Use of RegCM Results in Climate Change Impacts Studies Linda O. Mearns NCAR/ICTP Workshop on the Theory and Use of Regional Climate Models ICTP, Trieste, June 2003.

E N D
Use of RegCM Results in Climate Change Impacts Studies Linda O. Mearns NCAR/ICTP Workshop on the Theory and Use of Regional Climate Models ICTP, Trieste, June 2003
“Most GCMs neither incorporate nor provide information on scales smaller than a few hundred kilometers. The effective size or scale of the ecosystem on which climatic impacts actually occur is usually much smaller than this. We are therefore faced with the problem of estimating climate changes on a local scale from the essentially large-scale results of a GCM.” Gates (1985) “One major problem faced in applying GCM projections to regional impact assessments is the coarse spatial scale of the estimates.” Carter et al. (1994)
But, once we have more regional detail, what difference does it make in any given impacts assessment? What is the added value? Do we have more confidence in the more detailed results?
Use of Regional Climate Model Results for Impacts Assessments • Agriculture: • *Brown et al., 2000 (Great Plains – U.S.) • Guereña et al., 2001 (Spain) • *Mearns et al., 1998, 1999, 2000, 2001, 2003 (Great Plains, Southeast, and continental US) • *Carbone et al., 2003 (Southeast US) • *Doherty et al., 2003 (Southeast US) • *Tsvetsinskaya et al., 2003 (Southeast U.S.) • *Easterling et al., 2001, 2003 (Great Plains, Southeast) • Thomson et al., 2001 (U.S. Pacific Northwest) • *Pona et al., (in Mearns, 2001) (Italy)
Use of Regional Climate Model Results for Impacts Assessments 2 • Water Resources: Hassell and Associates, 1998 (Australia) Leung and Wigmosta, 1999 (US Pacific Northwest) *Stone et al., 2001, 2003 (Missouri River Basin) Arnell et al., 2003 (South Africa) Miller et al., 2003 (California) • Forest Fires: Wotton et al., 1998 (Canada – Boreal Forest)
Selected RegCM Impacts Studies • Mearns et al., 1997 - climate scenario formation incorporating changes in daily and interannual climate variability • Mearns et al., 1999, 2001 - application to corn, wheat, and soybeans in Great Plains • Pona et al., 2001 – wheat in Italy • Mearns et al., 2003 – multiple crops and economics in continental US • Stone et al., 2003 - water yield in the Missouri River basin
-10.7% -10.7 % 2.3 % Mearns et al., 1999, 2001
Wheat in Italy Where there is no coarse scale scenario
Land-sea mask CCM1 W&M 93
Integrated Assessment of Agriculture in the Southeastern U. S. Extension from impacts on crop yields to regional and national agricultural economics
Special Issue of Climatic Change: Climatic Variability, Change and Agriculture in the Southeast • Mearns, L. O., Introduction to the Special Issue on Climatic Variability, Change and Agriculture in the Southeast: An overview. • Mearns, L. O., F. Giorgi, C. Shields, and L. McDaniel, Climate Scenarios for the Southeast US based on GCM and Regional Model Simulations. • Carbone, G., W. Kiechle, C. Locke, L. O. Mearns, and L. McDaniel, Response of Soybeans and Sorghum to Varying Spatial Scales of Climate Change Scenarios in the Southeastern United States. • Doherty, R. M., L. O. Mearns, R. J. Reddy, M. Downton, and L. McDaniel, A Sensitivity Study of the Impacts of Climate Change at Differing Spatial Scales on Cotton Production in the SE USA. • Tsvetsinskaya, E., L. O. Mearns, T. Mavromatis, W. Gao, L. McDaniel, and M. Downton,The Effect of Spatial Resolution of Climate Change Scenarios on Simulated Corn, Wheat, and Rice Production in the Southeastern United States. • Adams, R. M., B. A. McCarl, and L. O. Mearns, The Economic Effects of Spatial Scale of Climate Scenarios: An Example From U. S. Agriculture.
Schematic of the Southeast Agricultural Project Direct CO2 Effect Technological Adaptations Climate Change Scenarios Crop Models CERES, CROPGRO, GOSSYM Ag Economic Modeling ASM Assumptions Economic Impacts Fine Scale CSIRO Coarse RegCM Fine Wheat, Corn, Rice, Sorghum, Cotton, Soybean Coarse Scale Crop Yield Change for rest of US
Climate Model Simulations and Scenario Formation Climate Change Scenarios CSIRO Coarse RegCM Fine Observed Climate Data Model Validation
Models Employed • Commonwealth Scientific and Industrial Research Organization (CSIRO) GCM – Mark 2 version • Spectral general circulation model • Rhomboidal 21 truncation (3.2 x 5.6); 9 vertical levels • Coupled to mixed layer ocean (50 m) • 30 years control and doubled CO runs • NCAR RegCM2 • 50 km grid point spacing, 14 vertical levels • Domain covering southeastern U.S. • 5 year control run • 5 year doubled CO runs
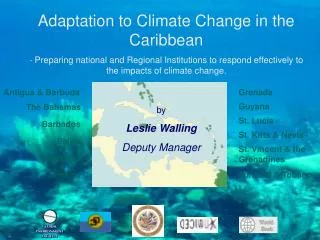
Domain of RegCM denotes study area + denotes RegCM Grid Point (~ 0.5o) X denotes CSIRO Grid Point (3.2 o lat. 5.6 o long)
RegCM Topography (meters) Contour from 100 to 4000 by 100 (x1)
Southeast domain average seasonal climate changes (2xCO2 versus control) of the CSIRO and RegCM (5 years each)
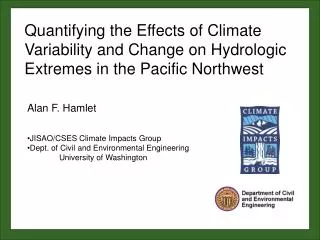
Climate Change - Δ Temperature (oC) CSIRO RegCM CSIRO RegCM Summer Fall Minimum Temperature Maximum Temperature 7.00 to 10.00 6.00 to 7.00 5.00 to 6.00 4.00 to 5.00 3.00 to 4.00 2.00 to 3.00 1.00 to 2.00 0.00 to 1.00 -1.00 to 0.00
Process of Forming Scenarios on Two Different Spatial Scales • 36-year observed climatology (max & min temp, precip, solar radiation) 1960-1995 – gridded on a 0.5º grid; • In the coarse resolution change, monthly changes, ratios from CSIRO climate change (2xCO2 – control) are appended to the observed climatology (i.e., all 0.5º grids falling within a CSIRO grid receive the same changes); • In the fine resolution change, changes from RegCM2 (thus higher resolution changes – each grid gets unique set of changes).
Schematic of the Southeast Crop Modeling Direct CO2 Effect Technological Adaptations Crop Models CERES, CROPGRO, GOSSYM Wheat, Corn, Rice, Sorghum, Cotton, Soybean Observed Climate Data
Crop Model Runs • Models: CERES, CROPGRO, GOSSYM • Crops: corn, cotton, rice, sorghum, soybean, wheat • Best agricultural soil used for each 0.5º grid based on STATSGO database. • All crop models run over entire domain (0.5º grid): • with climate observations 1960-1995, CO2 at 330 ppm;For coarse and fine scenarios, three cases: • climate change only, CO2 at 330 ppm; • climate change + direct CO2 fertilization effect (540 ppm); • climate change + direct CO2 fertilization effect + adaptations. • Management inputs: • Spatially varied sowing dates and cultivars; • No nitrogen stress; • Dryland and Irrigated.
At What Spatial Scales Do Contrasts in Simulated Crop Yields Matter? e.g., region – whole Southeast; State – GA, MS, etc. County – ~ to 50km grid
CROP Simulated Observed (T/ha) % Change from Base Yield CSIRO 330CO2 RegCM 330CO2 CSIRO 540CO2 RegCM 540CO2 CSIRO 540+A RegCM 540+A Corn 8.1 -13 -16 *_ 0 -2 * +7 +6 * Cotton 1.2 -4 -17 _ +8 -3 +29 +18 _ Rice 9.6 -16 -19 _ -3 -5 +2 +6 Sorghum 6.0 -36 -51 _ -26 -42 _ -17 -28 _ Soybean 2.4 -49 -69 _ -26 -54 _ -8 -46 _ Wheat 4.5 -36 -32 * -26 -21 * -25 -21 * South East Mean Dryland Yield Comparisons • irrigated (paddy) *CSIRO and RegCM yields are NOT significantly different (α = 0.05)
Summary of Changes in Crop Yields for the Southeast • In general, on a state level, changes in crop yieldsare significantly less negative, or more positive, with the coarse scale climate scenario than the fine scale. Exception is corn for the south central area, Arkansas for soybeans. • Wheat shows least contrast in yields with spatial scale. • Cotton fares best of all crops - largest increases for all three cases. • Soybean fares poorest - even with adaptation, yields still decrease substantially - more so for fine scale scenario. • Climate variables that explain the contrasts in climate changed yields based on spatial scale vary based on the crop. • Adaptation decreases the contrasting effect of the scenario spatial scales in terms of changes in crop yields.
Does regionalization of the climate change scenario matter in terms of economic indicators of the ASM?
Ag Economic Modeling ASM Assumptions Economic Impacts Fine Scale Coarse Scale Crop Yield Change for rest of US Schematic of Agricultural Economic Modeling
Overview of Agricultural Sector Model (ASM) • Represents production and consumption of major U.S. crops and livestock commodities; • Solved as a spatial equilibrium model; • Maximizes net economic welfare; • Includes processing of agricultural commodities and foreign trade; • Includes 63 production regions: region defined by soils, water, and other resource availability; • Effects of climate change in this assessment based on changes in yields and water use (from CERES and other crop models); • Has been used in many studies of climate change effects on agriculture.
Crop Modeling for the Rest of the United States Crop Yield Change for rest of US
GCM Consumer Surplus Producer Surplus Foreign Surplus Total Surplus CSIRO 5.96 -3.31 0.40 3.05 RegCM 3.47 -3.41 0.26 0.32 CSIROA 8.94 -3.87 0.62 5.69 RegCMA 7.76 -4.67 0.51 3.61 Changes in Welfare Results in Billion $
Conclusions Regionalization of the climate change scenarios matters in terms of the economic indicators of the ASM • Shows up in aggregate economic welfare (different orders of magnitude); • Regional patterns of agricultural production are altered; • more spatial variability with RegCM; • Southern states are more negatively affected by RegCM.
Conclusions (Con’t.) • Adaptation decreases the contrasting effect of scenario spatial scale on changes in the net economic effects. • The contrast in economic net welfare based on spatial scale of climate scenarios is similar in magnitude to the economic contrast resulting from use of two very different AOGCM simulations in the US National Assessment.
Water Yield Response to Climate Model Scale in the Missouri River Basin
Study Region • Missouri River Basin • 2,540 miles long • 529,000 miles2 • 10 US states and 2 Canadian provinces • 75,000 cfs • Highly regulated
SWAT Hydrologic Model • Models the hydrologic cycle • Continuous time - daily time step • Model objective: predict the effect of management decisions on water and sediment yields on large river basins
Models Employed • Commonwealth Scientific and Industrial Research Organization (CSIRO) GCM – Mark 2 version • Spectral general circulation model • Rhomboidal 21 truncation (3.2 x 5.6), about 400 km; 9 vertical levels • Coupled to mixed layer ocean (50 m) • 30 years control and doubled CO runs • NCAR RegCM2 • 50 km grid point spacing, 14 vertical levels • Domain covering western two thirds U.S. (Giorgi et al., 1998) • 5 year control run • 5 year doubled CO runs
Climate Grids GCM RegCM
Climate: July Precipitation GCM RegCM
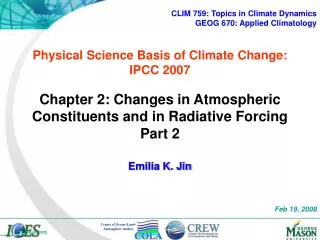
Water Yield: 6-Digit Subbasins, 25-Years GCM from Base RegCM from Base
Conclusions Scale of climate change model affects estimates of water yield
Needed Activities • Longer regional climate model runs (and higher spatial resolutions). • Applications to other regions of the world (e.g., island nations, tropical regions). • 3) Application of RCM and driving GCM results to other impacts models (e.g., human health, natural ecosystems). • Quality control of regional climate model output. • 5) Inclusion of uncertainty of spatial scale within context of uncertainty of large scale future climates (different emissions scenarios and different GCMs). • e.g., 3 emissions scenarios x 3 GCMs x 3 nested regional models and applications to impacts models
Socio-Economic Assumptions Emissions Scenarios Concentration Projections Radiative Forcing Projections Climate Projections Policy Responses: Adaptation and Mitigation Sea-Level Projections Climate Scenarios Interactions and Feedbacks Land Use Change Natural Perturbations (I.e.,volcanoes) Regional Climate Scenarios Global Change Scenarios Impacts Models Impacts
Needed Activities (cont.) 6) Conducting regional modeling experiments that further support current evidence that response of regional models to external forcings may be more realistic than that of the GCM providing boundary conditions.
Interdisciplinary Research: Activities that produce knowledge from integrating over more than one discipline. True interdisciplinary research involves melding the input of disciplines into both the design and execution of a unified project. Integrated Assessment:Method of analysis that combines results and models from the physical, biological, economic, and social sciences, and the interactions between these components in a consistent framework to evaluate the status and consequences of environmental change.