Download
1 / 41
460 likes | 945 Vues
Manufacturing Systems: EMP-5179 Module #9: Quality Function Deployment (QFD). Dr. Ken Andrews High Impact Facilitation Fall 2009. PRODUCT DESIGN. PROCESS DESIGN. PRODUCTION. IMPROVE PRODUCT. Impact High Cost to Change Low. Cost To Change High. Design – Quality Trade-off (QFD).

E N D
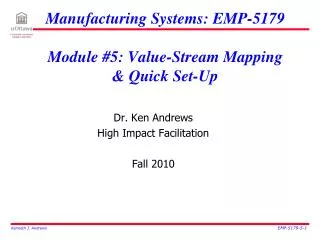
Manufacturing Systems: EMP-5179Module #9: Quality Function Deployment (QFD) Dr. Ken Andrews High Impact Facilitation Fall 2009
PRODUCT DESIGN PROCESS DESIGN PRODUCTION IMPROVE PRODUCT Impact High Cost to Change Low Cost To Change High Design – Quality Trade-off (QFD) 100:1 10:1 1:1 TIME The Quality Lever
Product Development Stages • Idea generation • Assessment of firm’s ability to carry out • Customer Requirements • Functional Specification • Product Specifications • Design Review • Test Market • Introduction to Market • Evaluation Scope of design for manufacturability and value engineering teams Scope of product development team
The New Product Development (NPD) Process • New Product Development Process • The method by which new products evolve from conceptualization through engineering to manufacturing and marketing. • Market Success Depends on NPD • Continuously generate new product ideas. • Convert ideas to reliable functional designs. • Ensure that the designs are readily producible. • Select the processes most compatible with customer needs.
The New Product Development (NPD) Process • Concurrent Engineering • The simultaneous and coordinated efforts of all functional areas which accelerates the time to market for new products.
The New Product Development(NPD) Process • Idea Generation • Market pull: the “voice of the customer” in providing feedback to determine product specifications. • Technology push: a product developed by the firm’s R&D is “pushed” into the market. • Concept Development • Initial product design developed and tested. • Analysis of the market and customer requirements.
The New Product Development(NPD) Process • Quality Function Deployment (QFD) • The process for translating customer requirements into a product’s design. • Voice of the Customer • Customer feedback is used in QFD process to determine product specifications. • Customer attributes: • Product needs • Product preferences
The New Product Development(NPD) Process • House of Quality • The part of the QFD process that uses customer feedback for product design criteria. • Use of QFD teams • Identify important customer attributes. • Design superior product. • Shorten product design time. • Facilitate inter-functional cooperation.
The New Product Development(NPD) Process • New Product Planning • Build models of new product. • Test new elements and components. • Conduct detailed investment and financial analyses of product’s anticipated life cycle. • Design for Manufacturability (DFM) • Choosing manufacturing methods and materials. • Minimizing the number of individual parts: • Reduces assembly time. • Increases reliability. • Setting product specifications. • Output from the design activity that states all criteria for building a product.
Quality Function Deployment • Identify customer wants • Identify how the good/service will satisfy customer wants • Relate customer wants to product hows • Identify relationships between the firm’s hows • Develop importance ratings • Evaluate competing products
Idea Generation Stage • Provides basis for entry into market • Sources of ideas • Market need (60-80%); engineering & operations (20%); technology; competitors; inventions; employees • Follows from marketing strategy • Identifies, defines, & selects best market opportunities
Identifies & positions key product benefits Stated in core benefits proposition (CBP) Example: Long lasting with more power (Sears’ Die Hard Battery) Identifies detailed list of product attributes desired by customer Focus groups or 1-on-1 interviews House of Quality Product Characteristics Customer Requirements Customer Requirements Stage
House of Quality Product Characteristics Customer Requirements Functional Specification Stage • Defines product in terms of how the product would meet desired attributes • Identifies product’s engineering characteristics • Example: printer noise (dB) • Prioritizes engineering characteristics • May rate product compared to competitors’
House of Quality Component Specifications Product Characteristics Product Specification Stage • Determines how product will be made • Gives product’s physical specifications • Example: Dimensions, material etc. • Defined by engineering drawing • Done often on computer • Computer-Aided Design (CAD)
Quality Function Deployment • Product design process using cross-functional teams • Marketing, engineering, manufacturing • Translates customer preferences into specific product characteristics • Involves creating 4 tabular ‘Matrices’ or ‘Houses’ • Breakdown product design into increasing levels of detail
QFD • Structured approach for design • Developed at Mitsubishi’s Kobe shipyards • “House of quality” – built on relationships • Customer requirements • Design requirements • Competitive assessment • Technical assessment • 4 layers: product, part, process, production
Japanese/US Engineering Change Comparison Introduction of First Product Japanese (Using QFD) United States (Not Using QFD) Design Changes out 1-3 months out 20-24 months out 14-17 months market introduction in production 3 months Time QFD Can Reduce Both Costs and Start-Up Time
Interrelationships Customer requirement priorities Technical requirements Voice of the customer Relationship matrix Technical requirement priorities Competitive evaluation House of Quality
QFD Steps • Identify/ prioritize customer requirements. • Determine technical requirements. • Relate customer requirements to technical requirements. • Compare ability to meet requirements against competitive products. • Determine correlation of design requirement elements. • Set targets for technical requirements and determine capability. • Look for high opportunity requirements to satisfy customer. • Continue QFD process to the next level.
THE BASIC HOUSE OF QUALITY • Establishes the Flowdown • Relates WHAT'S & HOW'S • Ranks The Importance The Basis of QFD is the House
THE BASIC HOUSE OF QUALITY KEY ELEMENTS INFORMATIONAL ELEMENTS Two Element Types In Each House
KEY ELEMENTS - “WHAT’S” • What Does The Customer Want • Customer Needs Need 1 Need 2 Need 3 Need 4 Need 5 Need 6 Need 7 WHAT'S Voice of the Customer
1. Identify Customer Attributes • These are product or service requirements IN THE CUSTOMER’S TERMS. • Market Research; • Surveys; • Focus Groups. • “What does the customer expect from the product?” • “Why does the customer buy the product?” • Salespeople and Technicians can be important sources of information – both in terms of these two questions and in terms of product failure and repair. • OFTEN THESE ARE EXPANDED INTO Secondary and Tertiary Needs / Requirements.
KEY ELEMENTS - CUSTOMER IMPORTANCE • How Important Are The What’s TO THE CUSTOMER • Customer Ranking of their Needs Need 1 Need 2 Need 3 Need 4 Need 5 Need 6 Need 7 5 5 3 4 2 4 1 Customer Importance Voice of the Customer
WHAT'S HOW'S KEY ELEMENTS - “HOW’S” • How Do You Satisfy the Customer What’s • Product Requirements • Translation For Action HOW 1 HOW 2 HOW 3 HOW 4 HOW 5 HOW 6 HOW 7 HOW'S 5 5 3 4 2 4 1 Need 1 Need 2 Need 3 Need 4 Need 5 Need 6 Need 7 Satisfy the Customer Needs
2. Identify Design Attributes. • Design Attributes are Expressed in the Language of the Designer / Engineer and Represent the TECHNICAL Characteristics (Attributes) that must be Deployed throughout the DESIGN, MANUFACTURING, and SERVICE PROCESSES. • These must be MEASURABLE since the Output will be Controlled and Compared to Objective Targets. • The ROOF of the HOUSE OF QUALITY shows, symbolically, the Interrelationships between Design Attributes.
H L L M H M M L H L M M L H L M KEY ELEMENTS - RELATIONSHIP • Strength of the Interrelation Between the What’s and the How’s • H Strong 9 • M Medium 3 • L Weak 1 HOW 1 HOW 2 HOW 3 HOW 4 HOW 5 HOW 6 HOW 7 5 5 3 4 2 4 1 Need 1 Need 2 Need 3 Need 4 Need 5 Need 6 Need 7 Relationship Untangling The Web
3.Relating Customer & Design Attributes • Symbolically we determine whether there is NO relationship, a WEAK one, MODERATE one, or STRONG relationship between each Customer Attribute and each Design Attribute. • The PURPOSE it to determine whether the final Design Attributes adequately cover Customer Attributes. • LACK of a strong relationship between A customer attribute and any design attribute shows that the attribute is not adequately addressed or that the final product will have difficulty in meeting the expressed customer need. • Similarly, if a design attribute DOES NOT affect any customer attribute, then it may be redundant or the designers may have missed some important customer attribute.
45 5 5 15 45 9 9 3 36 2 6 12 4 36 1 M KEY ELEMENTS - TECH. IMPORTANCE • Which How’s are Key • Where Should The Focus Lie HOW 1 HOW 2 HOW 3 HOW 4 HOW 5 HOW 6 HOW 7 5 3 4 2 4 1 Need 1 Need 2 Need 3 Need 4 Need 5 Need 6 Need 7 Technical Importance 57 41 48 13 50 6 21 Ranking The HOW'S
H L L M H M M L H L M M L H L M INFORMATION - TARGET DIRECTION HOW 1 HOW 2 HOW 3 HOW 4 HOW 5 HOW 6 HOW 7 • Information On The HOW'S • More Is Better • Less Is Better • Specific Amount Target Direction 65 45 21 36 8 52 4 5 5 3 4 2 4 1 Need 1 Need 2 Need 3 Need 4 Need 5 Need 6 Need 7 57 41 48 13 50 6 21 The Best Direction
H L L M H M M L H L M M L H L M INFORMATION - HOW MUCH • Target Values for the How’s • Note the Units HOW 1 HOW 2 HOW 3 HOW 4 HOW 5 HOW 6 HOW 7 65 45 21 36 8 52 4 5 5 3 4 2 4 1 Need 1 Need 2 Need 3 Need 4 Need 5 Need 6 Need 7 3 lbs 12 in. 3 mils 40 psi 3 8 atm 1 mm How Much 57 41 48 13 50 6 21 Consistent Comparison
3. Evaluate Design Attributes of Competitive Products & Set Targets. • This is USUALLY accomplished through in-house testing and then translated into MEASURABLETERMS. • The evaluations are compared with the competitive evaluation of customer attributes to determine inconsistency between customer evaluations and technical evaluations. • For example, if a competing product is found to best satisfy a customer attribute, but the evaluation of the related design attribute indicates otherwise, then EITHER the measures used are faulty, OR else the product has an image difference that is affecting customer perceptions. • On the basis of customer importance ratings and existing product strengths and weaknesses, TARGETS and DIRECTIONS for each design attribute are set.
Impact Of The How’s On Each Other Strong Positive Positive Negative Strong Negative H L L M H M M L H L M M L H L M INFORMATION - CORRELATION MATRIX Correlation Matrix HOW 1 HOW 2 HOW 3 HOW 4 HOW 5 HOW 6 HOW 7 65 45 21 36 8 52 4 5 5 3 4 2 4 1 Need 1 Need 2 Need 3 Need 4 Need 5 Need 6 Need 7 3 lbs 12 in. 3 mils 40 psi 3 8 atm 1 mm 57 41 48 13 50 6 21 Conflict Resolution
Enough theory! Let’s consider 2 case studies (details in class)
Manufacturing Environment Software Environment Service Environment Customer Wants Product Functionality System Characteristics Design Alternatives Customer Wants Service Requirements Service Processes Process Controls Customer Wants Technical Requirements Part Characteristics Manufacturing Process Production Requirements QFD FLOWDOWN Levels Of Granularity
House of Quality Sequence Indicates How to Deploy Resources to Achieve Customer Requirements
Quality Function Deployment Typical results of effective implementation of QFD: • 30% - 50% shorter design cycle • 30% - 50% fewer engineering changes • 40% lower start up costs • 35% fewer warranty claims
Quality Function Deployment Some Case Study examples: Martin Marietta Satellite server Space System: • Reduced proposal time by 20% • Decreased project costs by 30% 3M - Technology development of new material through development phase: • 50% reduction in product development time • 25% lower production costs • 25% reduction in rework • All project deadlines met
Creative Definitions of QFD • A systematic way of documenting and breaking down customer needs into manageable and actionable detail. • A planning methodology that organizes relevant information to facilitate better decision making. • A way of reducing the uncertainty involved in product and process design. • A technique that promotes cross-functional teamwork. • A methodology that gets the right people together, early, to work efficiently and effectively to meet customers’ needs.
Preparation for Next Week • I recommend you start your term paper very soon • Watch for new articles/links on the website • Watch for material for module #10