Overview of Workers' Compensation Trends and Economic Outlook for the Insurance Industry
860 likes | 992 Vues
This report, presented by Dr. Robert P. Hartwig from the Insurance Information Institute, delves into the state of the workers' compensation insurance sector as of 2011 and forecasts upcoming trends. It analyzes factors impacting profitability, including the influence of the economic climate and significant external pressures such as high catastrophes and low interest rates. The report emphasizes the importance of economic growth for insurance demand and highlights performance metrics from recent years, projecting future recovery and its implications on market dynamics.

Overview of Workers' Compensation Trends and Economic Outlook for the Insurance Industry
E N D
Presentation Transcript
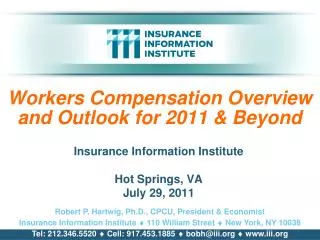
Workers Compensation Overview and Outlook for 2011 & Beyond Insurance Information Institute Hot Springs, VA July 29, 2011 Robert P. Hartwig, Ph.D., CPCU, President & Economist Insurance Information Institute 110 William Street New York, NY 10038 Tel: 212.346.5520 Cell: 917.453.1885 bobh@iii.org www.iii.org
P/C Insurance Industry Financial Overview Profit Recovery Will Be Set Back by High CATs, Low Interest Rates, Diminishing Reserve Releases 3
P/C Net Income After Taxes1991–2011:Q1 ($ Millions) P-C Industry 2011:Q1 profits were down 12.2% to $7.8B vs. $8.9B in 2010:Q1, as underwriting results deteriorated • 2005 ROE*= 9.6% • 2006 ROE = 12.7% • 2007 ROE = 10.9% • 2008 ROE = 0.3% • 2009 ROAS1 = 5.9% • 2010 ROAS = 6.5% • 2011:Q1 ROAS = 5.6% * ROE figures are GAAP; 1Return on avg. surplus. Excluding Mortgage & Financial Guaranty insurers yields a 6.5% ROAS for 2011:Q1, 7.5% for 2010 and 7.4% for 2009. Sources: A.M. Best, ISO, Insurance Information Institute
A 100 Combined Ratio Isn’t What ItOnce Was: Investment Impact on ROEs A combined ratio of about 100 generated ~7.5% ROE in 2009/10,10% in 2005 and 16% in 1979 Combined Ratio / ROE Combined Ratios Must Be Lower in Today’s DepressedInvestment Environment to Generate Risk Appropriate ROEs * 2009 and 2010 figures are return on average statutory surplus. 2008 -2011 figures exclude mortgage and financial guaranty insurers Source: Insurance Information Institute from A.M. Best and ISO data.
Profitability Peaks & Troughs in the P/C Insurance Industry, 1975 – 2011* History suggests next ROE peak will be in 2016-2017 ROE 1977:19.0% 1987:17.3% 2007:12.3% 10 Years 1997:11.6% 2011:6.1%* 10 Years 10 Years 1975: 2.4% 2001: -1.2% 1992: 4.5% 1984: 1.8% *Profitability = P/C insurer ROEs are I.I.I. estimates. 2011 figure is an estimate based on annualized ROAS for Q1 data. Note: Data for 2008-2011 exclude mortgage and financial guaranty insurers. Source: Insurance Information Institute; NAIC, ISO, A.M. Best.
The BIG Question:When Will the Market Turn? Insurance Cycle Dynamics 7
Criteria Necessary for a “Market Turn”:All Four Criteria Must Be Met Sources: Barclays Capital; Insurance Information Institute. eSlide – P6466 – The Financial Crisis and the Future of the P/C
Workers Compensation and the Economy Workers Comp Exposure and Performance is Intimately Linked to the Economy and Labor Market 10
US Real GDP Growth* The Q4:2008 decline was the steepest since the Q1:1982 drop of 6.8% Real GDP Growth (%) Recession began in Dec. 2007. Economic toll of credit crunch, housing slump, labor market contraction has been severe but modest recovery is underway 2011 got off to a sluggish start, but growth is expected to accelerate in the remainder of the year. This is a major positive for insurance demand and exposure growth. Demand for Insurance Continues To Be Impacted by Sluggish Economic Conditions, but the Benefits of Even Slow Growth Will Compound and Gradually Benefit the Economy Broadly * Estimates/Forecasts from Blue Chip Economic Indicators. Source: US Department of Commerce, Blue Economic Indicators 7/11; Insurance Information Institute. eSlide – P6466 – The Financial Crisis and the Future of the P/C
2011 Financial Overview State Economic Growth Varied in 2010 Hard hit Midwest and Northeast states finally entering recovery in 2010 Texas had one of the stronger economies in 2010 and has generally outperformed during the economic downturn eSlide – P6466 – The Financial Crisis and the Future of the P/C
Direct Premiums Written: All P/C Lines Percent Change by State, 2005-2010 Top 25 States North Dakota is the growth juggernaut of the P/C insurance industry—too bad nobody lives there… Sources: SNL Financial LC.; Insurance Information Institute.
Direct Premiums Written: All P/C Lines Percent Change by State, 2005-2010 Bottom 25 States US Direct Premiums Written declined by 1.6% between 2005 and 2010 States with the poorest performing economies also produced the most negative net change in premiums of the past 5 years Sources: SNL Financial LC; Insurance Information Institute.
Wage and Salary Disbursements (Payroll Base) vs. Workers Comp Net Written Premiums Payroll Base* WC NWP $Billions $Billions 12/07-6/09 7/90-3/91 3/01-11/01 WC premium volume dropped two years before the recession began WC net premiums written were down $14B or 29.3% to $33.8B in 2010 after peaking at $47.8B in 2005 29% of NPW has been eroded away by the soft market and weak economy *Private employment; Shaded areas indicate recessions. Sources: NBER (recessions); Federal Reserve Bank of St. Louis at http://research.stlouisfed.org/fred2/series/WASCUR ; NCCI; I.I.I. eSlide – P6466 – The Financial Crisis and the Future of the P/C
Direct Premiums Written: Worker’s CompPercent Change by State, 2005-2010* Top 25 States 5,807.1 Only 7 (small) states showed growth in workers comp premium volume between 2005 and 2010 *Excludes monopolistic fund states: ND, OH, WA, WY as well as WV, which transitioned to a competitive structure during this period. Sources: SNL Financial LC.; Insurance Information Institute.
Direct Premiums Written: Worker’s CompPercent Change by State, 2005-2010* Bottom 25 States Workers Comp DPW plunged 28.7% from between 2005 and 2010 States with the poorest performing economies also produced the most negative net change in premiums of the past 5 years *Excludes monopolistic fund states: ND, OH, WA, WY as well as WV, which transitioned to a competitive structure during this period. Sources: SNL Financial LC.; Insurance Information Institute.
Crisis-Driven Exposure Drivers in Workers Comp Economic Obstacles and Opportunities to Growth 22
New Private Housing Starts, 1990-2016F New home starts plunged 72% from 2005-2009; A net annual decline of 1.49 million units, lowest since records began in 1959 (Millions of Units) The plunge and lack of recovery in homebuilding and in construction in general is holding back payroll exposure growth Job growth, improved credit market conditions and demographics will eventually boost home construction Little Exposure Growth Likely for Homeowners Insurers Until 2013. Also Affects Commercial Insurers with Construction Risk Exposure, Surety Source: U.S. Department of Commerce; Blue Chip Economic Indicators (10/10 and 7/11); Insurance Information Institute. eSlide – P6466 – The Financial Crisis and the Future of the P/C
Auto/Light Truck Sales, 1999-2016F New auto/light truck sales fell to the lowest level since the late 1960s. Forecast for 2011-12 is still far below 1999-2007 average of 17 million units, but a recovery is underway. (Millions of Units) Job growth and improved credit market conditions will boost auto sales in 2011 and beyond Car/Light Truck Sales Will Continue to Recover from the 2009 Low Point, Bolstering the Manufacturing Sector. Source: U.S. Department of Commerce; Blue Chip Economic Indicators (10/10 and 7/11); Insurance Information Institute. eSlide – P6466 – The Financial Crisis and the Future of the P/C
Recovery in Capacity Utilization is a Positive Sign for Commercial Exposures Percent of Industrial Capacity “Full Capacity” The US operated at 76.7% of industrial capacity in Jun. 2011, above the June 2009 low of 68.3% Hurricane Katrina The closer the economy is to operating at “full capacity,” the greater the inflationary pressure March 2001-November 2001 recession December 2007-June 2009 Recession 25 Source: Federal Reserve Board statistical releases at http://www.federalreserve.gov/releases/g17/Current/default.htm.
Business Bankruptcy Filings,1980-2011:Q1 % Change Surrounding Recessions 1980-82 58.6% 1980-87 88.7% 1990-91 10.3% 2000-01 13.0% 2006-09 208.9%* 2010 bankruptcies totaled 56,282, down 7.5% from 60,837 in 2009—which were up 40% from 2008 and the most since 1993. 2011:Q1 filings are down 14.4% from 2010:Q1. Significant Exposure Implications for All Commercial Lines as Business Bankruptcies Begin to Decline Sources: American Bankruptcy Institute at http://www.abiworld.org/AM/AMTemplate.cfm?Section=Home&TEMPLATE=/CM/ContentDisplay.cfm&CONTENTID=61633 ; Insurance Information Institute 27 12/01/09 - 9pm eSlide – P6466 – The Financial Crisis and the Future of the P/C
Private Sector Business Starts, 1993:Q2 – 2010:Q3* Business Starts2006: 872,0002007: 843,0002008: 790,0002009: 697,000 2010:Q3 526,000 (Thousands) 344,000 new business starts were recorded through the first half of 2010, which was likely the slowest year for new business starts since 1993. Business Starts Were Down Nearly 20% in the Recession, Holding Back Most Types of Commercial Insurance Exposure * Data through September 30, 2010 are the latest available as of July 25, 2011; Seasonally adjusted Source: Bureau of Labor Statistics, http://www.bls.gov/news.release/cewbd.t08.htm. 28 12/01/09 - 9pm eSlide – P6466 – The Financial Crisis and the Future of the P/C
11 Industries for the Next 10 Years: Insurance Solutions Needed Health Care Health Sciences Energy (Traditional) Many industries are poised for growth, but many insurers do not write in these economic segments Alternative Energy Agriculture/Agribusiness Natural Resources Environmental Technology (incl. Biotechnology) Light Manufacturing Export-Oriented Industries Shipping (Rail, Marine, Trucking) eSlide – P6466 – The Financial Crisis and the Future of the P/C
Value Contributed to GDP by Agricultural Sector, 2004-2010 $ Billions Agriculture and agribusiness are growing strongly relative to the rest of the US economy. Agriculture and Agribusiness will be among the growth leaders in the years ahead due to rising global demand and a low dollar--boosting exports Sources: US Bureau of Economic Analysis; Insurance Information Institute. eSlide – P6466 – The Financial Crisis and the Future of the P/C
Percentage Change in Employment in Select Industries, June 2011 vs. June 2010 Percentage Change Mining and Logging activities were the job growth leaders over the past year, in percentage terms There is a great deal of variation in employment growth by industry, indicating a very uneven and slow recovery Sources: US Bureau of Labor Statistics “Employment Situation, June 2011”; Insurance Information Institute. eSlide – P6466 – The Financial Crisis and the Future of the P/C
Change in Number Employedin Select Industries, June 2011 vs. June 2010 Thousands Professional Business Services, Health Care, and Trade, Transportation & Utilities) were the job growth leaders in the past year. There is a great deal of variation in employment growth by industry, indicating a very uneven and slow recovery Sources: US Bureau of Labor Statistics “Employment Situation, June 2011”; Insurance Information Institute. eSlide – P6466 – The Financial Crisis and the Future of the P/C
Percentage Change in Employment in Select Sub-Industries, June 2011 vs. June 2010 % Change Oil and Gas Extraction was among the fastest growing industry sub-segments over the past year, in % terms There is a great deal of variation in employment growth by industry, indicating a very uneven and slow recovery Sources: US Bureau of Labor Statistics “Employment Situation, June 2011”; Insurance Information Institute. eSlide – P6466 – The Financial Crisis and the Future of the P/C
Change in Number Employed in Select Sub-Industries, June 2011 vs. June 2010 Thousands Industries related to natural resource extraction, processing and manufacturing are doing well, along with health care There is a great deal of variation in employment growth by industry, indicating a very uneven and slow recovery Sources: US Bureau of Labor Statistics “Employment Situation, June 2011”; Insurance Information Institute. eSlide – P6466 – The Financial Crisis and the Future of the P/C
Where Will the Growth in WC Exposure Come From? Industry and Occupation Growth Analysis 35
Fastest Growing Occupations, 2008–2018:Health/Science/Tech Dominate WC exposure growth the fastest in the health, science and tech areas Sources: US Bureau of Labor Statistics: Occupational Outlook Handbook, 2010-2011 Edition; Insurance Information Institute eSlide – P6466 – The Financial Crisis and the Future of the P/C
Occupations with Largest Numerical Growth, 2008–2018: Health, Services Dominate Dollar growth in WC exposures should grow the most (at current rate levels) in the health and services industries Sources: US Bureau of Labor Statistics: Occupational Outlook Handbook, 2010-2011 Edition; Insurance Information Institute eSlide – P6466 – The Financial Crisis and the Future of the P/C
Numeric Change in Wage and Salary Employment in Service-Providing Industries: 2008-2018P (Thousands) Health, Science and Education will be important sources of exposure growth for WC insurers this decade Sources: US Bureau of Labor Statistics: Occupational Outlook Handbook, 2010-2011 Edition; Insurance Information Institute eSlide – P6466 – The Financial Crisis and the Future of the P/C
Labor Market Trends Massive Job Losses Sapped the Economy and Commercial/Personal Lines Exposure, But Trend is Improving 45
Unemployment and Underemployment Rates: Falling in 2011 January 2000 through June 2011, Seasonally Adjusted (%) U-6 went from 8.0% in March 2007 to 17.5% in October 2009; Stood at 16.2% in June 2011 Recession ended in November 2001 Unemployment kept rising for 19 more months Recession began in December 2007 Unemployment rate rose to 9.2% in June Unemployment peaked at 10.1% in October 2009, highest monthly rate since 1983. Peak rate in the last 30 years: 10.8% in November - December 1982 Jun 11 Stubbornly high unemployment and underemploymentwill constrain payroll growth, which directly affects WC exposure Source: US Bureau of Labor Statistics; Insurance Information Institute. 46 12/01/09 - 9pm eSlide – P6466 – The Financial Crisis and the Future of the P/C
Monthly Change in Private Employment January 2008 through June 2011* (Thousands) Private employers added jobs in every month in 2010 for a total of 1.435 million for the year 57,000 private sector jobs were created in June Monthly Losses in Dec. 08–Mar. 09 Were the Largest in the Post-WW II Period Private Employers Added 2.368 million Jobs Since Jan. 2010 After Having Shed 4.66 Million Jobs in 2009 and 3.81 Million in 2008 (State and Local Governments Have Shed Hundreds of Thousands of Jobs Source: US Bureau of Labor Statistics: http://www.bls.gov/ces/home.htm; Insurance Information Institute
Unemployment Rates by State, May 2011:Highest 25 States* In May, 24 states reported over-the-month unemployment rate decreases, 13 states and the District of Columbia had increases, and 13 had no change. *Provisional figures for May 2011, seasonally adjusted. Sources: US Bureau of Labor Statistics; Insurance Information Institute.
Unemployment Rates By State, May 2011: Lowest 25 States* In May, 24 states reported over-the-month unemployment rate decreases, 13 states and the District of Columbia had increases, and 13 had no change. The unemployment rate in Louisiana was 6.6% in May, well below the 9.0% overall US rate *Provisional figures for May 2011, seasonally adjusted. Sources: US Bureau of Labor Statistics; Insurance Information Institute.
US Unemployment Rate 2007:Q1 to 2012:Q4F* Jobless figures have been revised downwards for 2011/12 Rising unemployment eroded payrolls and workers comp’s exposure base. Unemployment peaked at 10% in late 2009. Unemployment forecasts remain stubbornly high through 2011, but still imply millions of new jobs will created. * = actual; = forecasts Sources: US Bureau of Labor Statistics; Blue Chip Economic Indicators (7/11); Insurance Information Institute eSlide – P6466 – The Financial Crisis and the Future of the P/C
Frequency: 1926–2008A Long-Term Drift Downward Manufacturing – Total Recordable CasesRate of Injury and Illness Cases per 100 Full-Time Workers Note: Recessions indicated by gray bars. Sources: NCCI from US Bureau of Labor Statistics; National Bureau of Economic Research eSlide – P6466 – The Financial Crisis and the Future of the P/C
Workers Compensation Operating Environment The Weak Economy and Soft Market Have Made the Workers Comp Operating Increasingly Challenging 65
Workers Compensation Premium Continues Its Sharp DeclineNet Written Premium $ Billions p Preliminary Source: 1990–2009 Private Carriers, Best's Aggregates & Averages; 2010p, NCCI 1996–2010p State Funds: AZ, CA, CO, HI, ID, KY, LA, MD, MO, MT, NM, OK, OR, RI, TX, UT Annual Statements State Funds available for 1996 and subsequent Calendar Year
Workers Compensation Net Premiums Written and Annual Growth Rates: 1970-2010P WC premium growth hit a 40+ year low in 2009 at -13%. Improving labor markets began to help in 2010/11. ($ Billions) Sources: A.M. Best (1973-2009); Insurance Information Institute calculations and estimates for 2010. eSlide – P6466 – The Financial Crisis and the Future of the P/C
Workers Comp Rate Changes,2008:Q4 – 2011:Q2 The Q2 2011 WC rate change was the first increase in many years (Percent Change) Source: Council of Insurance Agents and Brokers; Information Institute.
Average Approved BureauRates/Loss Costs History of Average WC Bureau Rate/Loss Cost Level Changes Percent Cumulative 2000–2003 +17.1% Cumulative 1994–1999 -27.8% Cumulative 2004–2011 -26.2% Cumulative 1990–1993 +36.3% * States approved through 4/23/2010 Countrywide approved changes in advisory rates, loss costs, and assigned risk rates as filed by the applicable rating organization Calendar Year *States approved through 4/8/11. Note: Countrywide approved changes in advisory rates, loss costs and assigned risk rates as filed by applicable rating organization. Source: NCCI.
Current NCCI Voluntary MarketFiled Rate/Loss Cost ChangesExcludes Law-Only Filings Ratio • States filed through 4/15/2011 • IN and NC filed in cooperation with state rating bureau • Source: NCCI
Impact of Discounting on Workers Compensation Premium NCCI States—Private Carriers Percent Policy Year p PreliminaryDividend ratios are based on calendar year statistics NCCI benchmark level does not include an underwriting contingency provision Based on data through 12/31/2010 for the states where NCCI provides ratemaking services Source: NCCI
Final Premium vs. Estimated Premium by Policy Effective Quarter: 2006:Q1 – 2009:Q3 Recession The recession led to negative premium audit adjustments Note: WC Statistical Plan audited premium compared to policy-estimated premium. Based on states where NCCI provides ratemaking services, including state funds; excludes high deductible policies and mid-term cancellations. Source: NCCI
Workers Compensation Combined Ratio: 1973–2012P WC was the worst performing of the major commercial lines in 2010. Workers Comp Underwriting Results Are Deteriorating Markedly Sources: A.M. Best; Insurance Information Institute. 2010 is NCCI figure for private carriers.
Workers CompensationInvestment Returns Investment Gain on Insurance Transactions-to-Premium Ratio Private Carriers Percent Average (1990–2009): 14.6% Calendar Year • p=Preliminary • Source: 1990–2009, Annual Statement Data; 2010p, NCCI • Investment Gain on Insurance Transactions includes Other Income • Adjusted to include realized capital gains to be consistent with 1992 and after • Source: NCCI Calendar Year
Workers Compensation ResultsModest Operating Loss Pre-Tax Operating Gain Ratio Private Carriers Percent Average (1990–2009): 6.3% • p Preliminary • Source: 1990–2009, Annual Statement Data; 2010p, NCCI • Operating Gain Equals 1.00 minus (Combined Ratio Less Investment Gain on Insurance Transactions and Other Income) • Adjusted to include realized capital gains to be consistent with 1992 and after • Source: NCCI Calendar Year
WC Combined Ratio Necessary to Achieve Cost of Capital WC combined ratios need to improve substantially (115 in 2010) in order generate a risk appropriate rate of return. (Percent) Assumptions: 3.8% Pre-Tax Investment Yield; 2.8% Post-Tax Investment Yield; WC R/S ratio = 2.07; Based on NCCI’s 2011 Internal Rate of Return Model Source: NCCI. eSlide – P6466 – The Financial Crisis and the Future of the P/C