Download
1 / 1
10 likes | 123 Vues
Correlation of solar flares with long-term irradiance and sunspot levels Ingolf E. Dammasch & Marie Dominique, Royal Observatory of Belgium

E N D
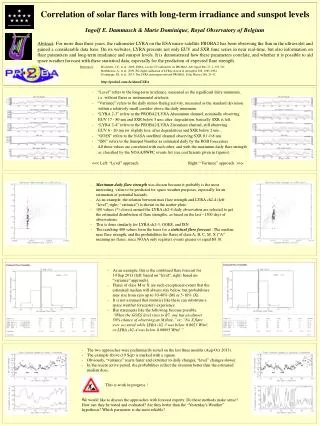
Correlation of solar flares with long-term irradiance and sunspot levels Ingolf E. Dammasch & Marie Dominique, Royal Observatory of Belgium Abstract: For more than three years, the radiometer LYRA on the ESA micro-satellite PROBA2 has been observing the Sun in the ultraviolet and gained a considerable data base. On its websites, LYRA presents not only EUV and SXR time series in near real-time, but also information on flare parameters and long-term irradiance and sunspot levels. It is demonstrated how these parameters correlate, and whether it is possible to aid space weather forecast with these statistical data, especially for the prediction of expected flare strength. References: Hochedez, J.-F., et al.: 2006, LYRA, a solar UV radiometer on PROBA2, Adv Space Res 37, 2, 303-312 BenMoussa, A., et al.: 2009, Pre-flight calibration of LYRA, Astron & Astrophys 508, 1085-1094 Dominique, M., et al.: 2013, The LYRA instrument onboard PROBA2, Solar Physics 286, 21-42 http://proba2.oma.be/data/LYRA • Maximum daily flare strength was chosen because it probably is the most interesting value to be predicted for space weather purposes, especially for an estimation of potential hazards. • As an example, the relation between max flare strength and LYRA ch2-4 (left: “level”, right: “variance”) is shown in the scatter plots. • 100 values (*) closest around the LYRA ch2-4 daily observation are selected to get the estimated distribution of flare strengths, as based on the last ~1300 days of observations. • This is done similarly for LYRA ch2-3, GOES, and ISN. • The resulting 400 values form the basis for a statistical flare forecast : The median max flare strength, and the probabilities for flares of class A, B, C, M, X (“A” meaning no flares, since NOAA only registers events greater or equal B1.0). - “Level” refers to the long-term irradiance, measured as the significant daily minimum, i.e. without flares or instrumental artefacts. - “Variance” refers to the daily minor-flaring activity, measured as the standard deviation within a relatively small corridor above the daily minimum. - “LYRA 2-3” refers to the PROBA2/LYRA Aluminium channel, nominally observing EUV 17 - 80 nm and SXR below 5 nm; after degradation, basically SXR is left. - “LYRA 2-4” refers to the PROBA2/LYRA Zirconium channel, still observing EUV 6 - 20 nm (or slightly less, after degradation) and SXR below 2 nm. - “GOES” refers to the NASA satellites' channel observing SXR 0.1-0.8 nm. - “ISN” refers to the Sunspot Number as estimated daily by the ROB forecasters. - All these values are correlated with each other, and with the maximum daily flare strength as classified by the NOAA/SWPC events list (see coefficients given in figures). <<< Left: “Level” approach. Right: “Variance” approach>>> • As an example, this is the combined flare forecast for • 19 Sep 2013 (left: based on “level”, right: based on • “variance” approach). • Flares of class M or X are such exceptional events that the • estimated median will always stay below, but probabilities • may rise from zero up to 30-40% (M) or 5-10% (X). • It is not assumed that statistics like these can substitute a • space weather forecaster's experience. • But statements like the following become possible: • “When the GOES level rises to B7, one has an almost • 50% chance of observing an M flare.” or: “No X flare • ever occurred while LYRA ch2-3 was below 0.0023 W/m², • or LYRA ch2-4 was below 0.00095 W/m².” • The two approaches were preliminarily tested on the last three months (Aug-Oct 2013). • The example above (19 Sep) is marked with a square. • Obviously, “variance” reacts faster and extremer to daily changes, “level” changes slower. • In the recent active period, the probabilities reflect the situation better than the estimated median does. • This is work in progress ! • We would like to discuss the approaches with forecast experts: Do these methods make sense? How can they be tested and evaluated? Are they better than the “Yesterday's Weather” hypothesis? Which parameter is the most reliable?