Molecular Interactions of PAWS1 with SMAD Proteins in TGF-β Signaling Pathway
Explore the interactions of PAWS1 with SMAD proteins, elucidating its role in the TGF-β signaling pathway.

Molecular Interactions of PAWS1 with SMAD Proteins in TGF-β Signaling Pathway
E N D
Presentation Transcript
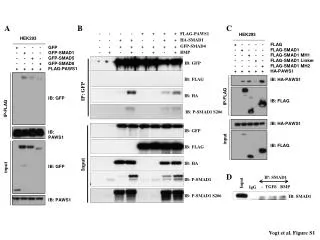
A B C - - - - + + + + FLAG-PAWS1 HEK293 HEK293 HA-SMAD1 - - + + - - + + + - - - - + - + - - - + - - + - - + - - - + - + - - - - + + FLAG FLAG-SMAD1 FLAG-SMAD1 MH1 FLAG-SMAD1 Linker FLAG-SMAD1 MH2 HA-PAWS1 GFP-SMAD4 - - + + + + + + + - - - + - + - - + - - + - + - - - + + GFP GFP-SMAD1 GFP-SMAD5 GFP-SMAD8 FLAG-PAWS1 BMP - + - + - + - + IB: GFP IB: FLAG IB: HA-PAWS1 IP: GFP IP-FLAG IB: HA IB: GFP IB: FLAG IP-FLAG IB: P-SMAD1 S206 IB: HA-PAWS1 input IB: GFP IB: PAWS1 IB: FLAG IB: FLAG input IB: HA Input IB: GFP D IB: P-SMAD1 IB: P-SMAD1 S206 IB: PAWS1 IP: SMAD1 Input - TGFß BMP IgG IB: SMAD1 Vogt et al. Figure S1
MDA-MB-231 U2OS HEK 293 RKO HaCaT HeLa MCF7 PC3 KBM7 IB: PAWS1 low PAWS1 IB: PAWS1 high A B PAWS1 IB: PAWS1 low Adiposetissue IB: SMAD1 Pancreas Epididymis Muscle Ovaries IB: PAWS1 high Spleen Thymus Kidney Testis Heart Brain Liver Lung IB: GAPDH IB: SMAD1 IB: GAPDH Vogt et al. Figure S2
ALK2 ALK6 0.010 0.100 0.100 0.001 0.001 0.010 0.003 0.030 0.300 1.000 3.000 10.00 0.003 0.030 0.300 1.000 3.000 10.00 0.000 0.000 LDN-193189 (µM) Coomassie 32P-Autorad Phospho-PAWS1 Vogt et al. Figure S3
A BMPR1 + GST-PAWS1(S610A) P1 662.6184 +2P P2 B 953.4414 +P Peak2 C Peak1 Vogt et al. Figure S4
120 240 45 0 BMP for min. 15 480 IP: PAWS1; IB: P-PAWS1 S610 IP: PAWS1; IB: PAWS1 IB: P-SMAD1 IB: SMAD1 IB: GAPDH Vogt et al. Figure S5
B A BxPC3 3 ASNS P<0.001 P<0.001 NEDD9 2 foldchange 1 0 - BMP 2 BMP 4/7 Vogt et al. Figure S6
Change in expression PAWS1+BMP/control 1.2 1 0.8 0.6 0.4 0.2 log fold change 0 -0.2 -0.4 -0.6 -0.8 -1 -1.2 genes below threshold genes above threshold A B unstimulated BMP-2 TGFBR2 ID1 PC3-control PC3-control PC3-control PC3-PAWS1 PC3-PAWS1 PC3-PAWS1 TSC22D C TGFBR2 TSC22D P=0.0007 P=0.0029 2.5 1.5 40 2.0 30 1.0 1.5 fold change fold change fold change 20 1.0 0.5 10 P<0.0001 0.5 ID1 P<0.0001 0.0 0.0 0 Vogt et al. Figure S7