Download
1 / 18
190 likes | 365 Vues
Souad Bouallala Patrick Tisserant ADEME (French environment and Energy management Agency) Air quality monitoring department. AIR QUALITY DATA FLOWS IN FRANCE. AQ monitoring, who does what ?. NATIONAL LEVEL Ministry of Environment (MEDD) ADEME

E N D
Souad Bouallala Patrick Tisserant ADEME (French environment and Energy management Agency) Air quality monitoring department AIR QUALITY DATA FLOWS IN FRANCE
AQ monitoring, who does what ? NATIONALLEVEL Ministry of Environment (MEDD) ADEME (general monitoring policy)(Technicalcoordination National Data Base Research Programmes) National AQ monitoring Laboratory LCSQA (technical support : metrology, modeling and quality assurance) LOCAL LEVEL 40 Air Quality Monitoring Entities (AQME) ( local implementation of monitoring, information...)
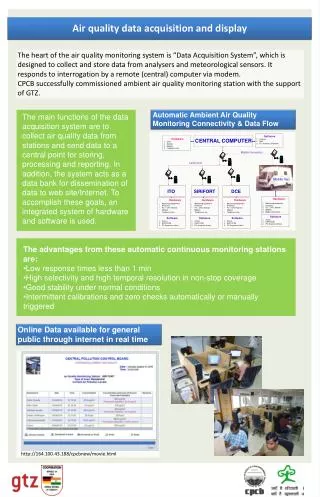
Air quality monitoring system 40 local air quality monitoring network entities ~700 monitoring stations, 2 500 monitoring devices Their mission: • to measure • to forecast • to inform (web, local authorities) They measure everyday : • regulated pollutants (SO2, NO2, O3, PM10, Pb, benzene, CO) • «new» pollutants (heavy metals, PAH, PM2.5, VOC, …)
Operational QA/QC procedures in AQME 1/ National calibration chain National reference standards (level 1) Regional reference standards (7 ) (level 2) Stations working standards (level 3) Transfer standards 1->2 and 2->3 SO2, NO-NO2, O3, CO, benzene
Operational QA/QC procedures in AQME 2/ Validation of data 1 - Automatic prevalidation 2 - Technical validation 3 – Environmental survey validation Processed data Extract from guideline « rules and recommandations of AQ data »
Air quality data flow chart 700 monitoring stations 32 regional servers national database 40 local monitoring network managing entities O3 NO2 SO2 PM10 PM2.5 BTX Iso files day ADEME National Information data exchange with the EEA and the EU AQME web sites National web site NATIONAL LOCAL
The National air quality database in France Objectives : • Data exchange with EEA • Air quality report and assistance in decision making • Scientific research • epidemiology studies, • model validation • Saving data of local network
AQDBusers in France • MEDD/IFEN, Ecole des mines de Douai INERIS, CNRS, AFSSE, INVS, INRA, Météo-France, LHVP, APPA, DRASS… • PREVAIR • Research laboratories : physico-chimistry, climate science, epidemiology • EEA, WHO, Joint Research Centre
Pollutants in AQDB Since 1985 (automatic data): • SO2, NO-NO2-NOx, O3, CO • particules (PM2.5), (PM10) (TSP) • Benzene,Toluène, o,m & p Xylene Each year about 20 millions hourly data (and 80 millions ¼ hourly data) For 2005: “manual” data • PAH (BaP), heavy metal : Cd, As, Ni, Hg, Pb • VOC, Precipitations
Number of data (representativity rate ) Mean (hourly, 8h, daily, mensually, annually) Percentiles (50, 98, 99,9) sur 1h, 24h Number of mean > value Number of days > value Number of exceedences AOT forest and vegetation The available statistics on the AQDB Available on www.atmonet.org
How air quality information is managing in national level ? • Air quality data store in the national database • Exporting data procedures • Quality procedures in AQDB
Air quality data store in the national database Hourly data (non validated) BASTER (NRT+3h) ISO V1.7 Hourly data Automatic VOC CSV Multi-timing data Manual data XML BDATMO Informix BULDAIR Mysql BASTER Informix Quarter hourly data AQDB ISO V1.7 Daily data AQ index Text file
EoI Data (97/101/EC) Year Y-1 for ETC/ACC ADEME - Data Supplier Checking Network Quarter hourly data ISO V1.7 Transfer FTP CDR E-mail Generator automat File generating ISO V2 BDATMO Informix EXPLOIT Informix Quality automat Data missing Data quality ETC/ACC ISO V2 Check ETC/ACC Upload Airbase Daily data arrival & statistic calculate
EoI Meta Data (97/101/EC) : Y-1 for ETC/ACC ADEME - Data Supplier Checking Network Meta Data Manual Input (futur XML) Transfer FTP CDR E-mail Generator automat File generating ISO V2 (et futur XML) BDATMO Informix EXPLOIT Informix Quality automat Data missing Data quality ETC/ACC ISO V2 Check ETC/ACC Upload Airbase Transfer
Ozone exceedances (2002/3/EC) ADEME - Data Supplier Manual transformation XML => XLS and checking Network Quarter hourly data ISO V1.7 Automatic E-mail with file 3 times / month CDR E-mail Generator Automat XML File generating Ozone BDATMO Informix EXPLOIT Informix Quality automat Data missing M-1 or Y ETC/ACC XLS Check Daily data arrival & statistic calculate
EMEP France (MERA) EMD ACCESS NETWORK Data MERA XML - XLS ADEME - Data Supplier File generating NASA EMEP Manual transformation XML => XLS and checking E-Mail EXPLOIT Informix Generator automat File generating XML Ozone – NO2 NILU XLS + NASA Automatic E-mail with XML file
Quality procedures in AQDB Mail Phone Checking missing Checking missing meta data data Iso file late AQ index file not receive Missing code town, opening station date, station type, ... New pollutant receive Outliers detected ATMO BDATMO LOCAL NETWORK ADEME EXPLOIT Stat Calculate Station longitude and latitude Bad information about measurement Meta data data Checking quality Checking quality
Main French web sites ATMO Air Pollution Index : www.ademe.fr or www.buldair.org Air Pollution Monitoring (DBQA): www.atmonet.org Forecastand NRT: www.prevair.org Emissions : www.citepa.org French regulations : www.ecologie.gouv.fr State of the Environment Reports : www.ifen.fr metrology : www.lcsqa.org In addition an AQI is calculated every day : • 58 conurb. > 100 000 inhab. • 57 conurb. 50 000 to 100 000 inhab • 18 smaller cities • released via « www.buldair.org »