Download
1 / 20
200 likes | 342 Vues
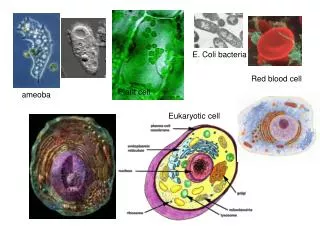
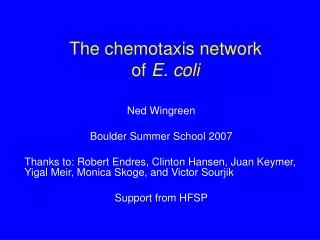
Modeling the chemosensing system of E. coli. Ned Wingreen – Princeton Juan Keymer – Princeton Robert Endres – Princeton/NEC Yigal Meir – Ben Gurion University. Outline. Introduction to chemotaxis in E. coli Runs and tumbles Signaling properties The chemotaxis network FRET

E N D
Modeling the chemosensing system of E. coli Ned Wingreen – Princeton Juan Keymer – Princeton Robert Endres – Princeton/NEC Yigal Meir – Ben Gurion University
Outline • Introduction to chemotaxis in E. coli • Runs and tumbles • Signaling properties • The chemotaxis network • FRET • New probe of receptor activity • Two regimes of activity • Receptors function collectively • Modeling • How does adaptation work?
Signaling properties of the chemotaxis network • “Precise and robust adaptation”: range of 3-4 orders of magnitude of attractant • “Signal integration”: multiple attractants • “Sensitivity”: amplification Segall, Block, and Berg (1986) CCW vs CW bias for tethered cells in response to step in attractant
The chemotaxis network http://www.rowland.harvard.edu/labs/bacteria/projects_fret.html …but signal integration and sensitivity are still not well understood.
Chemoreceptors Dimer Tar - aspartate, glutamate (~900 copies) Tsr - serine (~1600) Trg - ribose, galactose (~150) Tap - dipeptides (~150) (Aer - oxygen via FAD (150?)) Sensor Transmembrane helices Linker region • Attractant binding inhibits phosphorylation of CheA • Adaptation: • More attractant → increased methylation by CheR → increased rate of phosphorylation of CheA • Less attractant → increased demethylation by CheB → decreased rate of phosphorylation of CheA 380 A Methyl binding sites CheB, CheR Cytoplasmic domain CheA / CheW binding region Stock (2000)
Chemoreceptor clustering Receptors are clustered globally into a large array, and locally into trimers of dimers. Gestwicki et al. (2000) Kim et al. (1999); Studdert and Parkinson (2004)
In vivo FRET studies of receptor activity Real-time measurement of rate of phosphorylation of CheY. FRET also allows subcellular imaging, Vaknin And Berg (2004). Sourjik and Berg (2002)
FRET data: two regimes of activity Regime II Regime I Sourjik and Berg(2002) • Regime I: • Activity moderate to low at zero ambient MeAsp (0.06,1) • KD small and almost constant • Regime II: • Activity high (saturated?) at zero ambient MeAsp (1.3-1.9) • KD1 large and increasing with methylation • Plateau in activity • KD2approximately constant Two regimes of receptor activity consistent with 2-state receptor model.
Barkai and Leibler (1997) 2-state receptor model • Originally proposed by Asakura and Honda (1984). • Modified by Barkai and Leibler (1998) to explain precise and robust adaptation: • Receptor complex has 2 states: “on”, i.e. active as kinase, and “off”, i.e. inactive as kinase. • Demethylation only occurs in “on” state, i.e. when receptor is active, so that • Therefore, at steady state, • Which implies precise and robust adaptation of each receptor complex to a fixed activity.
Two regimes of a 2-state receptor On Off Off On Off Off On On But first, a “1-state” receptor: Regime I Regime II • Regime I: • Activity low to very low at zero ligand concentration • KD = KDoff • Regime II: • Activity high (saturated) at zero ligand concentration • KD increasing as εon↓ Off Free Energy Off KD Ligand Ligand Ligand However, single receptor does not account for low apparent KD in Regime I.
Receptor-receptor coupling Duke and Bray (1999) Duke and Bray (1999) proposed that receptor-receptor coupling could enhance sensitivity to ligands. Toy model: if N receptors are all “on” or all “off” together, • Regime I (Δε > 0): • Low activity ~ e-NΔεat zero ligand concentration • KD=KDoff/ N • Hill coefficient = 1 • Regime II (Δε < 0): • KD = KDoffe-Δε • Hill coefficient = N Receptor-receptor coupling gives enhanced sensitivity (low KD) in Regime I, and enhanced cooperativity (high Hill coefficient ) in Regime II.
Review of FRET data Less Tars More Tars • Regime I • Low, constant KD • Activity low at zero ligand concentration • Hill coefficient ≈ 1 • Regime II: • KD1 increasing with methylation • Activity high at zero ligand concentration • Hill coefficient ≈ 1 ? • Plateau in activity ? =KDoff/N, value of N? Hill coefficient increases with receptor homogeneity. Must consider mixture of different receptor types. Sourjik and Berg (2004)
Model: 1d mixed lattice of receptors EJ Tar Tsr • Regime I: • KDset by coupling energy EJ • Regime II: • Plateaus: Tars “off”, Tsrs “on” • Hill coefficient ≈ 1, no cooperativity because Tar receptors separated by Tsr receptors Normalized Activity Log([MeAsp])
Less Tars More Tars Receptor homogeneity and cooperativity • Receptors are in Regime II: • Hill coefficient increases with homogeneity because clusters of identical receptors grow. • KD (or KD1) increases as lattice becomes more mixed because of coupling EJto “on” receptors. Normalized Activity Log([MeAsp])
Adaptation Tar Tsr Adaptation uses methylation to return all receptors to Δε≈ 0, and thereby enhances sensitivity. Δε > 0 Δε ≈ 0 Δε ≈ 0 Δε > 0 Δε ≈ 0 Δε > 0 Δε≈ 0 Off
ΔFRET for Tar(QEQE) strain Scaling of wild-type response data Sourjik and Berg: Δ[MeAsp] → ΔFRET{Tar(QEQE)} “Free energy” scaling: Δ[MeAsp] → Δ(Fon – Foff) Sourjik and Berg (2002) Includes zero-ambient data! Doesn’t collapse zero-ambient data.
Predictions • For homogeneous lattice – • Transition from Regime I to Regime II with methylation • Adaptation range set by KDon Activity MeAsp Sourjik (unpublished)
Open questions • Lattice structure? • Mechanism of receptor-receptor coupling? • Do other receptors work this way? Stock (2000)
Conclusions • Signaling properties of the chemotaxis network: • Precise and robust adaptation • Signal integration • Sensitivity • FRET studies reveal two regimes of activity • Regime I: low activity and constant KD • Regime II: high activity and increasing KD • Model of coupled 2-state receptors account for signaling properties, and for two regimes • Regime I (Δε > 0): coupling → enhanced sensitivity • Regime II (Δε < 0): coupling → enhanced cooperativity (but only for homogeneous clusters) • Adaptation “homogenizes” receptors (Δε≈0) for enhanced sensitivity