Uncertainties and errors
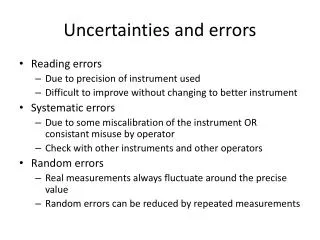
Uncertainties and errors. Reading errors Due to precision of instrument used Difficult to improve without changing to better instrument Systematic errors Due to some miscalibration of the instrument OR consistant misuse by operator

Uncertainties and errors
E N D
Presentation Transcript
Uncertainties and errors • Reading errors • Due to precision of instrument used • Difficult to improvewithoutchanging to better instrument • Systematicerrors • Due to somemiscalibration of the instrument OR consistantmisuse by operator • Check with other instruments and other operators • Randomerrors • Real measurementsalwaysfluctuatearound the precise value • Randomerrorscan be reduced by repeatedmeasurements
Measurements are accurateif the systematicerror is small • Measurents are preciseif the randomerror is small • Usuallywewantaccurate and precise measurements!
Significantdigits: • Always round your answer to as manysignificantnumbers as the weakestlink of the input! • ... unless your commonsensetells you different. It is allowed to usecommonsense in physics!
Line of best fit: • Oftenmeasured data can be illustrated by a plot • Oftenmeasured data end up more or less on a straigtline in a plot. How to draw this line with a ruler is usuallyjudged by eye. • Oftenwewant to know the slope of the line and where it crosses the y-axis (or x-axis) • Equation of a straight line: • m = slope (or gradient) • c = intercept (on y-axis) • The plots of manyfunctionscan be made to look linear by changingthe scale of an axis • Parabola • Hyperbola
Page 13: questions 1, 2, 3, 4 + read chapter 1.4 (scalars and vectors)