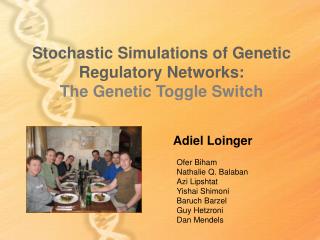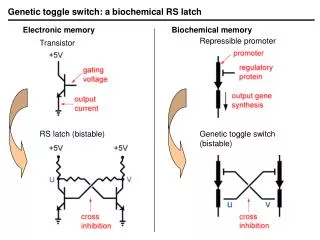
Genetic Toggle Switch
Genetic Toggle Switch. construction and modeling. Toggle switch design. How it works?. State 0. X. X. How it works?. Switching from state 0 to 1 : applying the inducer 2. How it works?. State 1. X. To switch back to state 0…. Gene Cloning. Toggle switch plasmid.

Genetic Toggle Switch
E N D
Presentation Transcript
Genetic Toggle Switch construction and modeling
How it works? State 0 X X
How it works? Switching from state 0 to 1 : applying the inducer 2
How it works? State 1 X To switch back to state 0…
Toggle switch plasmid How to select promoters?
Model - Equations x – concentration of repressor 1 y – concentration of repressor 2 a1,2 – effective rate of synthesis of x,y b,g – cooperativity of repression from promoter 1,2
Results Nullclines Parameters a1=a2=100 b=g=2 (b, g>1) • three steady states; one unstable, two stable – bistability • in the case of b, g=1 there is one stable steady state stable steady state (High) y stable steady state (Low) unstable steady state x
Results Bifurcation diagram Bistability requires: • a1, a2 do not differ greatly • b,g are not drastically different • how “drastic” difference of a1 vs. a2 is tolerated depends on the magnitude of b and g
Estimation of a1 and a2 • Recombinant promoters used: • PL-s1con>Ptrc-2>PLtetO-1 • Mutant RBS sequences (SD): • A>B>C>D>E>F>G • Overall synthesis strength is P+RBS • steady state GFP levels measured • through fluorescence
Bistable constructs R1 is cIts for pTAK series tetR for pIKE series
Model predictions - treshold pTAK117 a1=156.25 a2=15.6 b=2.5 g=1 m=2.0015 K=2.9818E-5 3.92323e-5 LocBif/WinPP
Genetic circuit analysis and engineering analyzing existing genetic circuits MODELING construction of new genetic circuits
References Gardner TS, Cantor CR, Collins JJ (2000) Construction of a genetic toggle switch in Escherichia coli. Nature 403:339-342 Yagil G, Yagil E (1971) On the relation between effector concentration and the rate of induced enzyme synthesis. Biophys J 11:11-27 WINPP and LOCBIF http://www.math.pitt.edu/~bard/classes/wppdoc/readme.htm