Electric Fields Enhance Directional Migration of MDCK Cells in Microfabricated Pillar Arrays
This study investigates the influence of electric fields (EFs) on the migration of MDCK cells using microfabricated traction force-detecting micropillar arrays. Cells were seeded on fibronectin-coated pillars, and their migration under EFs was analyzed through traction force assessment and particle image velocimetry. Results indicate that MDCK cells exhibit increased speed and directedness toward the anode when exposed to an EF. Our findings contribute to understanding cellular responses to EFs, with implications in tissue engineering and regenerative medicine.

Electric Fields Enhance Directional Migration of MDCK Cells in Microfabricated Pillar Arrays
E N D
Presentation Transcript
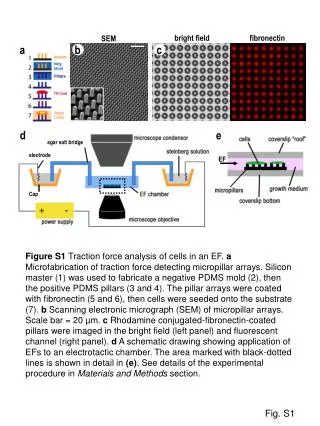
bright field fibronectin SEM a b c d e agar salt bridge electrode EF Cap Figure S1 Traction force analysis of cells in an EF. a Microfabrication of traction force detecting micropillar arrays. Silicon master (1) was used to fabricate a negative PDMS mold (2), then the positive PDMS pillars (3 and 4). The pillar arrays were coated with fibronectin (5 and 6), then cells were seeded onto the substrate (7). b Scanning electronic micrograph (SEM) of micropillar arrays. Scale bar = 20 µm. c Rhodamine conjugated-fibronectin-coated pillars were imaged in the bright field (left panel) and fluorescent channel (right panel). d A schematic drawing showing application of EFs to an electrotactic chamber. The area marked with black-dotted lines is shown in detail in (e). See details of the experimental procedure in Materials and Methods section. Fig. S1
b 200 mV/mm a No EF - c Figure S2 Directional migration of MDCK cells in monolayer in an EF. a, b Representative plots of the velocity field for MDCK II cell monolayer based on particle image velocimetry (PIV) analysis. The arrows indicate the velocity vectors at different positions of the image. The velocity vectors are randomly oriented in the absence of EF whereas the velocity vectors show clear biased orientation toward the anode of an applied EF. c The directedness (cos θ) of MDCK II cell monolayer using the data from the PIV analysis. Fig. S2
a MDCK II cells * * Coefficient of movement efficiency Migration speed (mm/h) Isolation Monolayer Isolation Monolayer b MDCK I cells * Coefficient of movement efficiency * Migration speed (mm/h) Isolation Monolayer Isolation Monolayer c NRK cells * * Coefficient of movement efficiency Migration speed (mm/h) Isolation Monolayer Isolation Monolayer d Tracheal epithelial cells † * Coefficient of movement efficiency Migration speed (mm/h) Isolation Monolayer Isolation Monolayer Fig. S3
Figure S3 Electric fields increased migration efficiency in MDCK, NRK and tracheal epithelial cells. a Migration speed and migration efficiency of MDCK II cells in isolation and in a monolayer culture based on single cell tracking. EF = 200 mV/mm for 6 hours. b Migration speed and migration efficiency of MDCK I cells. EF = 200 mV/mm for 6 hours. c Migration speed and migration efficiency of NRK cells. EF = 200 mV/mm for 2 hours. d Migration speed and migration efficiency of tracheal epithelial cells in isolation and in monolayer. EF = 200 mV/mm for 30 minutes. Data are from at least 100 cells from 3 independent experiments and shown as Mean ± S.E.M. *, p<0.01 compared with cells in isolation. †, p<0.05 compared with cells in isolation. See Supplementary information, Video S2.
- - c 100 b a -50 150 mm 1h 0h -100 - - 30 d e f -10 50 mm 0h 1h -30 h g * * * * * * * * * * * * Directedness (cos q ) Directedness (cos q ) 0 10 20 30 40 50 60 0 10 20 30 40 50 60 Time in EF (min) Time in EF (min) i j * Coefficient of movement efficiency Migration speed (mm/h) * Isolation Monolayer Isolation Monolayer Fig. S4
Figure S4 Collectively, bovine corneal epithelial cells migrate significantly more directionally in a physiological electric field. a-c Isolated bovine corneal epithelial cells (BCECs) migrated directionally to the cathode in an EF of 50 mV/mm for 1 hour. Lines and arrows represent migration paths and direction. d-f Monolayer BCECs migrated more directionally to the cathode in a field of the same strength. g, h Significantly higher migration directedness of cells in a monolayer than that of cells in isolation in both 50 and 100 mV/mm for 1 hour. i, j Migration speed and migration efficiency of BCECs in isolation and in monolayer in 50 mV/mm for 1 hour. Data are from at least 100 cells from 3 independent experiments and shown as mean ± S.E.M. *, p<0.01 compared with in isolation. Scale bars, 50 µm.
a b Cut edge Cut edge Control Oleamide - - d c 100 100 -150 50 -150 50 µm µm -100 -100 e f Vehicle Control Oleamide * Migration speed (µm/h) Directedness (cos q ) Vehicle Control Oleamide * Figure S5 Role of Gap junctions in collective electrotaxis. a, b MDCK I cells in a monolayer culture were scrape-loaded with Lucifer yellow dye, and the dye was efficiently transferred from dye-loaded cells to adjacent cells in control conditions (a), while little dye transfer was seen after cells were treated with oleamide (b). c, d Migration tracks of MDCK I cells in vehicle control or oleamide containing medium. e, f Migration directedness and speed of the cells in an EF with or without oleamide. EF = 200 mV/mm for 6 hours. Data are from at least 100 cells from 3 independent experiments and shown as Mean ± S.E.M. *, p<0.01 compared with vehicle control. Scale bars, 30 µm. Fig. S5
- - No EF a 03:15 05:45 00:50 + + b c Figure S6 Isolated MDCK cells do not re-orient traction forces under an EF. a Time-lapse images of a GFP-tagged α5 integrin expressing cell on micro-fabricated pillar substrate. White arrow head and length indicate the direction and magnitude of traction forces, respectively. Time in hh:mm. b EF application did not change the directionality of traction force. c The average traction force of isolated cells showed little change under an applied EF. The data are shown as Mean ± S.E.M. EF = 200 mV/mm for 4 hours. Fig. S6