Distribution Reliability
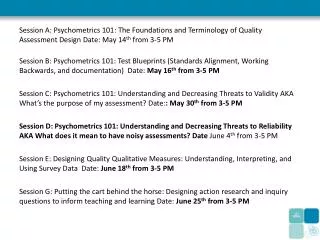
2014 Electric T&D Benchmarking. Distribution Reliability. Community Insights Conference August 20-22, 2014 Vail, CO. Agenda. Overview Industry Perspective (SCQA) 1QC Community Key Success Factors Performance Profiles & Trends Cost/Service 2014 Benchmarking Results

Distribution Reliability
E N D
Presentation Transcript
2014 Electric T&D Benchmarking Distribution Reliability Community Insights Conference August 20-22, 2014 Vail, CO
Agenda • Overview • Industry Perspective (SCQA) • 1QC Community Key Success Factors • Performance Profiles & Trends • Cost/Service • 2014 Benchmarking Results • Functional-specific findings
Where Are We: 1QCIndustry Perspective for Distribution Reliability
Summary and conclusions • IEEE 1366 has become the predominant standard for measuring reliability. • The long-term trend of decreasing reliability appears to be moderating over the last few years. • Initiatives to improve reliability continue to focus on tree trimming, increased maintenance and process improvement. • The majority of utilities are providing Estimated Restoration times for 100% of customer interruptions • Top performers tend to have characteristics that are endemic to their system.
SAIDI Outcomes Including Major Events is mostly better than last year, Excluding Major Events is slightly worse. Including Major Events & Planned Outages Excluding Major Events (2.5 Beta Method) Distribution Reliability Pg 4, 5 Source: DR5
Profiles: SAIFI Outcomes All values are better than last year’s, except first quartile Excluding Including Major Events & Planned Outages Excluding Major Events (2.5 Beta Method) Distribution Reliability Pg 8, 10 Source: DR5
Profile: CAIDI Outcomes Most values are somewhat worse than last year, except mean and 2nd Quartile Including Major Events Excluding Major Events (2.5 Beta Method) Including Major Events & Planned Outages Distribution Reliability Pg 12, 14 Source: DR5
CAIDI/SAIFI Scatter Only 1 of 14 companies is top quartile in all 3
Saidi by cause (excluding Major events and planned outages) Trees and Distribution Equipment make up over 50% of SAIDI for 6 of 15 respondents, over 40% for 12 of 15. Distribution Reliability Pg 23 Source: DR30
Outage Cause per Mile (excluding major events) Mean is worse, median better than last year for Customer Minutes, mean and median are better for Customer Interruptions Customer Interruptions per 100 Circuit Miles Customer Minutes per Mile Distribution Reliability Pg 32, 41 Source: DR35, DR45, ST35
Internal SAIDI target (excluding major events) Mean for Targets is 89 vs. 117 last year. Mean does not include outlier #28 Distribution Reliability Pg 45 Source: DR60
Percent of customers by number of interruptions Results are not as good as last year Distribution Reliability Pg 46 Source: DR65
CEMIn (% of customers with n or more interruptions) Results are not as good as last year CEMI4 CEMI3 These charts will be in a later edition of the report. Source: DR65
Percent of customers by interruption duration Mean is better, quartiles worse, this year’s outlier not included in statistics. Distribution of Outage Durations Percent Customer Interruptions >8 Hours Distribution Reliability Pg 48 Source: DR45, DR80
IEEE Major Event Days Per Year Most companies don’t vary much year to year, but a few have large variations Correlating % SAIDI from major events with major event days yields pretty good results (R 2= .631). Removing one outlier (64% SAIDI, 2 major event days), yields R2 = .930 This chart is not in the current report Source: DR95
Initiatives • Outage Management Systems • OMS information • Improving mapping and connectivity information • Strategies to improve effectiveness of OMS • Estimated restoration times (ERT’s) • Where provided • ERT accuracy • Worst circuit performance
OMS Vendor, version, and date of last major upgrade Most commercial products have been upgraded in the last few years. The number of In-house systems has decreased since 2011. * Company 30 uses a product from SPL, now owned by Oracle Distribution Reliability Pg 59-62 Source: DR45, DR80
Improving mapping and connectivity information Exception Reporting and Correction is used more than all others combined. • Last Year’s Summary • Regular monitoring – 5 • Exception reporting and correction –6 • System Update – 1 • Other - 1 Distribution Reliability Pg 62 Source: DR127
Improving mapping and connectivity information (cont.) Distribution Reliability Pg 62 Source: DR127
Percent of outages where ert is provided The vast majority provide ERT’s for all customers Distribution Reliability Pg 65 Source: DR135
ERT Accuracy Definition • ERT accuracy is the percent of ERT's that are within X minutes before, and Y minutes after the actual restoration time • 4 companies reported using this definition, with X and Y defined below. There is no difference year-to-year for the same companies. 2013 2014 Distribution Reliability Pg 69 Source: DR 155
Reported ERT Accuracy • There is no standard way to measure ERT accuracy, but all who reported use the X before and Y after definition • Very little difference between this year and last • Most are at or near their goal Goal = 90% Goal = 90% Goal = 80% Goal = 85% Goal = 68% Not in current report Source: DR160, DR170
Channels through which customers can get ert All have multiple channels. All “non-traditional” channels increased, IVR decreased. “Other” reported related to mass communication and communication with Government Emergency Management. Last Year This Year Distribution Reliability Pg 75 Source: DR185
Initiatives taken to improve reliability Worst circuit improvement is slightly ahead of Tree Trimming this year. Reclosers was mentioned by multiple companies under “Other” Distribution Reliability Pg 53, 54 Source: DR105, DR106
Actions to Improve SAIFI/CAIDI Companies have specific approaches to improving each of the standard reliability metrics; several mentioned practice improvements to improve CAIDI Distribution Reliability Pg 55, 56 Source: DR110, DR115
Reliability Correlation with External Factors The following slides examine the correlation of several features of the system that are not controllable (customer density, circuit density, etc) Customer Density (customers/square mile) Weak correlation, but higher density tends to better reliability
Reliability Correlation with External Factors – Cust per Ckt Mile Customer Density (customers/square mile) Weak correlation, but higher customers per ckt mile tends to lower CAIDI
Reliability Correlation with Controllable Factors – Work Headquarters The following slides examine the correlation of several features of the system that are controllable (work headquarters, O&M spend, SCADA penetration, etc) Weak Correlation for both, but higher sq miles per work center tends to have higher CAIDI.
Reliability Correlation with Controllable Factors – O&M Spend This slide compares O&M expense per Circuit Mile to SAIDI, SAIFI, CAIDI Correlations are very weak, and tend to show increased frequency and duration for increased spending. This is probably due to the fact that the spending is in response to poor reliability in past years
Reliability Correlation with Controllable Factors – O&M Spend This slide compares Average O&M expense per Circuit Mile for the previous 3 years to SAIDI, SAIFI, CAIDI Correlations are much better comparing O&M spend for recent years to current years reliability. This makes sense since money spent in the current year would only have minimal effect on this year’s reliability.
Reliability Correlation with Controllable Factors – Percent UG This slide compares Percent Underground Distribution to SAIDI, SAIFI, CAIDI Good correlation with SAIFI, weaker with SAIDI, virtually no correlation with CAIDI
Reliability Practices and Initiatives of Top Reliability Performers INITIATIVESTAKENTOIMPROVERELIABILITY[RANKTHETOP3,WITH3BEINGTHEMOSTIMPORTANT] -- Top Performers Only • Top 3: • Tree Trimming • Worst Circuit Improvement • Outage Process Improvement • Remainder: • Repair and Replacement based on inspection • Sectionalizers • Reclosers
Reliability Practices and Initiatives of Top Reliability Performers Other Characteristics of Top Performers • None of the top performers relies on an In-house OMS. There is no clear choice among vendors • Of the 8 top performers, all but two were relatively high density (>400 customer/sq mi), in an arid climate, or both. • All who reported use some kind of continuous exception and correction routine to maintain mapping and connectivity current
Thank you for your Input and Participation! Your Presenters Ken Buckstaff Ken.Buckstaff@1QConsulting.com310-922-0783 Tim SzybalskiTim.Szybalski@1QConsulting.com 925-878-5066 Debi McLain CookDebi.McLain@1QConsulting.com760-272-7277 Dave CanonDave.Canon@1QConsulting.com817-980-7909 Dave CarterDavid.Carter@1QConsulting.com414-881-8641 About 1QC First Quartile Consulting is a utility-focused consultancy providing a full range of consulting services including continuous process improvement, change management, benchmarking and more. You can count on a proven process that assesses and optimizes your resources, processes, leadership management and technology to align your business needs with your customer’s needs. Visit us at www.1stquartileconsulting.com | Follow our updates on LinkedIn Corporate Offices California 400 Continental Blvd. Suite 600El Segundo, CA 90245(310) 426-2790 Satellite Offices Maryland 3 Bethesda Metro Center Suite 700Bethesda, MD 20814 New York | Texas | Wyoming | Wisconsin