Download

1 / 32
320 likes | 522 Vues
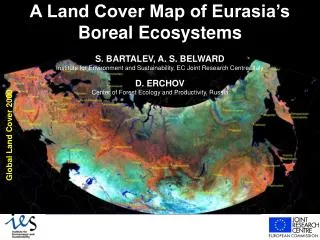
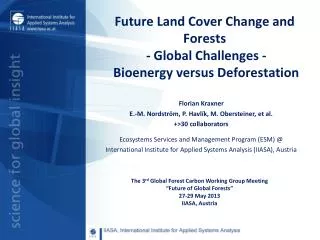
Future Land Cover Change and Forests - Global Challenges - Bioenergy versus Deforestation. Florian Kraxner E.-M. Nordström , P . Havlík , M . Obersteiner, e t al. +>30 collaborators Ecosystems Services and Management Program (ESM) @

E N D
Future Land Cover Change and Forests - Global Challenges - Bioenergy versus Deforestation Florian Kraxner E.-M. Nordström, P. Havlík, M. Obersteiner, et al. +>30 collaborators • Ecosystems Services and Management Program (ESM) @ • International Institute for Applied Systems Analysis (IIASA), Austria The 3rd Global Forest Carbon Working Group Meeting “Future of Global Forests” 27-29 May 2013 IIASA, Austria
Sustainable bioenergy feedstock- global scenarios and outlookFlorian Kraxner, E.-M. Nordström, P. Havlík, M. Obersteiner, et al.Ecosystems Services and Management Program, IIASA Bio-energy and CCS (BECCS): Options for Brazil, 13-14 June 2013, Sao Paulo, Brazil
ESM Lead / Management (MGT) (Obersteiner/Kraxner) ESM’s Organizational Structure Environmental Resources and Development (ERD) (Havlik/ Mosnier/Valin) Methods for Economic Decision–Making under Uncertainty (MEDU) (Khabarov/Fuss) Policy and Science Interface (PSI) (Kraxner/Boettcher) Forest Ecosystems Management (FEM) (Forsell) Agro-Environmental Systems (AES) (v.d.Velde/Balkovic) Earth Observation Systems (EOS) (Fritz/See)
Modeling Biomass Supply at Global Scale – An Integrated Modeling Approach 3 1 2 Source: IIASA (2011)
Biophysical forest model G4M • Forest parameters from G4M • Provides annual harvestable wood (for sawn wood and other wood) • Afforestation/Deforestation (NPV) • Forest management (rot/spec) • Forest Carbon stock • Downscaling FAO country level information on above ground carbon in forests (FRA 2005) to 30 min grid (Kinderman et al., 2008) • Harvesting costs • Forest area change • Spatially explicit
Input Data Sets for the Global Forestry Model (G4M) • NPP • Population Density • Land cover • Agricultural suitability • Forest Biomass • Price level • Discount rate • Corruption • Product use Source: Kindermann (2010)
Forest Area Development A2r (2000 – 2035) Source: IIASA, G4M (2008)
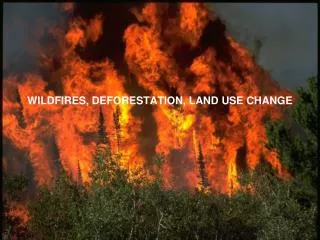
Deforestation 2050 under BAU • Losses under BAU by 2050 will be 300-500 mio ha • Tropical deforestation is considered the second largest source of anthropogenic greenhouse gas emissions (IPCC, 2007) and is expected to remain a major emission source for the foreseeable future (MEA, 2005) • the net effect of all deforestation is basically almost an increase of 20 per cent additional emissions from human activity going into the atmosphere and feeding into climate change. • deforestation is to blame for about one and a half billion tons of carbon dioxide being released into the atmosphere every year for the past 15 years (GCP). • To the left we see the picture of tropical Africa now and in 2100 under BAU (the more red the less tropical forest, www.geo-bene.eu/?q=node/1653) Source: Kindermann et al. 2006
The Biophysical Agriculture Model EPIC Cropland - EPIC Processes • Weather • Hydrology • Erosion • Carbon sequestration • Crop growth • Crop rotations • Fertilization • Tillage • Irrigation • Drainage • Pesticide • Grazing • Manure Major outputs: Crop yields, Environmental effects (e.g. soil carbon, ) 20 crops(>75% of harvested area) 4 management systems:High input, Low input, Irrigated, Subsistence Source: Schmid (2008)
EPIC – Management Change (conventional minimum tillage) SOC Crop Yield increase SOC0.18 t/ha/year DM Crop Yield-0.30 t/ha, or -7.9% Source: INSEA, Schmid (2006)
EPIC - Relative Difference in Means (2050/2100) in Wheat Yields Source: Data: Tyndall, Afi Scenario, simulation model: EPIC (2011)
GLOBIOM Model general structure • Partial equilibrium model on land use at global scale (endogenous prices balance supply and demand) • Agriculture: major agricultural crops and livestock products • Forestry: managed forests for sawnwood, and pulp and paper production • Bioenergy: conventional crops and dedicated forest plantations • Optimization of the social welfare (producer + consumer surplus) • Base year 2000, recursively dynamic (10 year periods) • Supply defined at the grid cell resolution • Demand defined at the level of 52 world regions • Main data source: FAOSTAT, complemented with bottom-up sectoral models for production parameters
GLOBIOM - Supply chain Wood products Sawn wood Pulp LAND USE CHANGE Natural Forests Wood Processing Bioenergy Bioethanol Biodiesel Methanol Heat Electricity Biogas Managed Forests Short Rotation Tree Plantations Bioenergy- Processing Crops Corn Wheat Cassava Potatoes Rapeseed etc… Cropland Grassland Livestock Feeding Livestock products Beef Lamb Pork Poultry Eggs Milk Other natural land
World partitioned in 52 regions 28 regionsrepresented on the map + Sub-saharanAfrica split in Western Africa, EasternAfricaand SouthernAfrica (Congo Basin and South Africaalreadyseparated)
GLOBIOM: Typical applications • Agricultural prospective • Schneider et al. (2011) Impacts of population growth, economic development, and technical change on global food production and consumption. Agricultural Systems • Smith et al. (2010) Competition for land, Philosophical transactions • Applied scenarios such as Eastern Africa with CCAFS • Deforestation • Mosnier et al. (2010) Modeling impacts of development trajectories on forest cover in the Congo Basin • Living Forest Report – WWF (2011) • Climate change mitigation • Valin et al. (2010) Climate change mitigation and food consumption patterns • Biofuels • Fuss et al. (2011) A stochastic analysis of biofuel policies • Havlik et al. (2010) Global land-use implications of first and second generation biofuel targets. Energy Policy • Mosnier et al. (2010) Direct and indirect trade effects of EU biofuel targets on global GHG emissions • Trade and trade-off assessments • Direct and indirect water demand of feedstock/livestock production systems
Globally Consistent Assessment of Forest Development and Bioenergy…
Background Global Future Energy Portfolios, 2000 – 2100 Source: modified after Azaret al., 2010
Cumulative biomass production (EJ/grid) for bioenergy between 2000 and 2100 at the energy price supplied by MESSAGE based on the revised IPCC SRES A2r scenario (country investment risk excluded). Source: Rokityanskiy et al. 2006
Forest Area Development A2r (2000 – 2035) Source: IIASA, G4M (2008)
Forest Management Certification (Potentials) Certified area relative to managed forest area by countries Kraxner et al., 2008 Source: compiled from FAO 2005, 2001; CIESIN 2007, ATFS 2008; FSC 2008; PEFC 2008.
Global BE Feedstock Scenarios – Definitions & Objectives Objectives: to achieve a global perspective using an integrated modeling approach; to frame the boundaries for lower scale assessments; and to identify potential trade-offs to be considered in future research. Zero Net Deforestation and Degradation (ZNDD) means no net forest loss through deforestation and no net decline in forest quality through degradation. WWF, 2011
Global Deforestation Trends Cumulative deforestation 2000-2050 caused by land-use change according to the different scenarios. • BEPlus similar to BAU • BE2010 on same high level because of unrestricted deforestation • RED keeps deforestation at present level
Regional Effects by Adding BE, Biodiv, RED - Unmanaged Forest rel to BAU Loss of pristine (unmanaged) forest as a proxy for BE production on Biodiversity Cumulative loss of area of unmanaged forest 2000-2050 in different regions under the BAU scenario Cumulative loss of area of unmanaged forest 2000-2050 in different regions under the BEPlus RED scenario • most of the loss of unmanaged forest takes place in the tropical areas of South America, Africa and Asia • the loss of unmanaged forest is not only considerably smaller but also more evenly distributed from a global perspective
GHG Emissions by Scenarios GHG emissions from total land use 2000-2050 under the different scenarios • Under the BE2010 scenario, the bioenergy use is small compared to the other scenarios, and the GHG emissions are the highest, 8,091 Mt CO2/year. The GHG emissions are lower under the BAU and BEPlus scenarios, where the bioenergy use is more extensive. • Lowest GHG emissions can be achieved under the RED scenarios
Agricultural Water Demand by Scenarios Water consumption for agriculture 2000-2050 under the different scenarios • All scenarios show increased demand • Lowest restriction on forest and biodiversity conservation show less water need • Higher restriction implies less land available for eg food production = intensification
Summary & Discussion & Conclusions • The demand for bioenergy will be high and will increase competition for land • Bioenergy production is a significant but not the major driver of forest loss • Avoiding large-scale deforestation is possible, even under expanded bioenergy production. • Unmanaged forest will be lost under all scenarios but under the RED scenarios the loss is only half of the loss under the BAU scenario • GHG emissions may be substantially reduced by minimizing deforestation • Minimization of deforestation may have negative impacts on other natural ecosystems • The more forest and biodiversity one would like to be conserved, the less land will be available for food production • The more conservation and protection, the higher the need for optimization and intensification • Various policy areas must be coordinated to ensure sustainable use of resources • Future studies need to go into the details identified here
Contact Florian Kraxner Ecosystem Services and Management Program International Institute for Applied Systems Analysis, IIASA Laxenburg, Austria kraxner@iiasa.ac.at http://www.iiasa.ac.at Paper contribuion: Florian Kraxner; Eva-Maria Nordström; et al. (2013). Global Bioenergy Scenarios - Future Forest Development, Land-Use Implications, and Trade-Offs. Biomass and Bioenergy (in press)