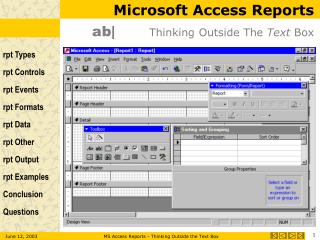
Distributing ILLiad Reports Created Using Microsoft Access
Distributing ILLiad Reports Created Using Microsoft Access. David Larsen Head of Access Services University of Chicago Library d-larsen@uchicago.edu. Or, “Now that I’ve taken the Generating Reports in OCLC ILLiad Class, how do I get my reports to those who need to see them?”.

Distributing ILLiad Reports Created Using Microsoft Access
E N D
Presentation Transcript
Distributing ILLiad ReportsCreated Using Microsoft Access David Larsen Head of Access Services University of Chicago Library d-larsen@uchicago.edu
Or,“Now that I’ve taken the Generating Reports in OCLC ILLiad Class,how do I get my reports to those who need to see them?”
Why Distribute MS Access Queries and Reports? • Need to summarize and display data in ways that can’t be done through ILLiad client or web reports. • Need to provide reports to those who don’t know how to use ILLiad or don’t have access to client. • Want to let individuals see data but not alter information in tables. • Want to automatically “push” information to those who need it or allow them to “pull” it themselves.
Two Approaches • Provide users with the actual MS Access “.mdb” files and a simplified interface that allows reports to be run as needed without training in MS Access. • Schedule reports to be automatically run and sent via email to interested individuals.
Example of First Approach ILLiad Borrowing Report • Provided to bibliographers • Shows loan requests for borrowing • Provides ability to specify academic department and date range
When Borrowing Report is opened, users only see a simple formwith a drop-down menu, two text boxes, and two buttons.
Users can select department from a drop-down box thatdisplays a list generated from a dynamic ILLiad query.
Users can specify a date range or accept the default daterange (previous week).
Report Exported to Excel Report in Excel Format
Benefits of this Approach • Users can run reports at any time • Can export to Excel, HTML, or Rich Text • Can create interface that allows use by those untrained in MS Access or ILLiad • Users can choose from a wide range of options using drop-down and text entry boxes
Disadvantages of this Approach • Users need Microsoft Access • Need to set up ODBC connections on all machines that run reports • Firewalls may prevent access to ILLiad server • Underlying tables remain accessible to users with knowledge of Access • Configuring easy-to-use interface requires lots of time and skill • Users need to remember to run reports
Another Approach:Schedule reports to automatically run with results sent via email
Imagine opening your email each morning and finding a half dozen ILLiad Reports in your Inbox that summarize the previous day’s ILL activity.
Report for Acquisitions, recommending purchase of itemsthat couldn’t be obtained through ILL.
Report showing users who need to be charged fines for late returns.
Benefits of This Approach • Users don't need to remember to run reports • Most find email a convenient way to receive information • Eliminates security and firewall concerns • Users don't need to have MS Access or configure ODBC settings • Don't need to spend lots of time simplifying MS Access interface • Reports can be scheduled to run during closed times, reducing load on server
Disadvantages of This Approach • Recipients do not have control over report scheduling or content • Report criteria need to be configured in advance (no drop-downs or text entry boxes) • Need to consider privacy implications of using email if reports contain sensitive data
How to Schedule Reports to Automatically Run with Results Sent via Email
Four Steps • Create MS Access queries and reports • Create MS Access macro to output report as MS-DOS text. • Create batch file that runs macro and emails report using Blat, a free email utility. • Use Windows Task Scheduler to run batch file at regularly specified times.
Step-by-Step Example Creating, scheduling, and emailing a report to Acquisitions recommending that the Library purchase recent imprints that could not be obtained through ILL
Step One Create Microsoft Access queries and reports. (Just like Stephanie Spires teaches inGenerating Reports in OCLC ILLiad)
Create a “make table” query that outputs results to a table called “ILL Cancels”
This query produces a list of all borrowing loans from the past week with the “Cancelled by ILL Staff” status, an imprint date in this millennium, and a “Reason for Cancellation” matching the specified criteria.
Create a report based on the “ILL Cancels” table created by the query.
PossibleReport Design
Avoid random blank lines by following the advice in Microsoft Knowledge Base Article 208436(http://support.microsoft.com/kb/q208436/) Fraction Decimal Equivalent 1\8 .125 1\4 .25 3\8 .375 1\2 .5 5\8 .625 3\4 .75 7\8 .875 Set the Height property of a report's detail section to a value divisible by .125 inches. For example, if the detail section's Height property contains a fractional number, set the fractional portion of this property value to one of the following decimal equivalents:
Report Preview
Step Two Create Microsoft Access macro that will run report and output results to a text file.
Macro consists of four steps that automate running of query and output of report.
First Step: “SetWarnings” to “No”This tells MS Access to suppress messages and warnings that would typically require a user response.
Second Step: “OpenQuery”This runs the “make table” query we created.
Third Step: “OutputTo”This outputs the “ILL Cancellations” report as an MS-DOS text file named “illcancels.txt” in the “c:\ill” directory.
Third Step (Part Two):Select the “Conditions” option under the “View” menu. Then enter a logical condition that tells MS Access to only output the report if the report contains data.
Fourth Step: “Quit” Shuts down MS Access at end of macro.