Inflation: Exploring Economic Data During the Great Depression
Learn about inflation, deflation, and stagflation, how inflation is calculated, causes of inflation, wage-price spiral, effects on individuals, and analyzing inflation rate fluctuations during 1929-1942.

Inflation: Exploring Economic Data During the Great Depression
E N D
Presentation Transcript
; Inflation During the Great Depression • What economic data might you use to explain what you see in the photograph? • What does this image reveal about prices and wages from 1929-1942? • What is happening in this photograph? • What interesting details do you see in this photograph? A New York City restaurant offers bargain prices to attract customers.
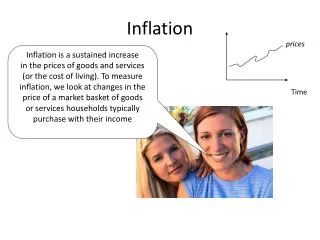
Inflation is an increase in the average price of goods and services in an economy.Deflation is a decrease in the average price of goods and services.Stagflation is a situation in which prices increase but the economy does not grow
How is inflation calculated? By using the Consumer Price Index (CPI)! • 400 goods and services are calculated in the “Market Basket” • Each group of items is weighted to reflect how much consumers spend on it • Re-calculated yearly to find the difference • Growth of the price index = inflation!
Normal: • A certain amount of inflation is normal and expected. • The normal (“creeping”) rate of inflation is 3.4% per year. Abnormal: • HYPERINFLATION: Inflation goes into overdrive! • Germany in the 1920’s (Loaf of bread: 1 mark in 1920, 2 billion marks in 1923) • Zimbabwe, 2008 (1000%) • DEFLATION: Prices go down over time • Good for consumers, savers, & lenders • Bad for borrowers & businesses
; What causes inflation? • Quantity Theory: • Too much money circulating!!! • Demand-Pull Theory: • Demand for goods exceeds supply & causes a shortage…“Pulls” prices upwards • Cost-Push Theory: • Costs of production increase, so prices are “pushed” upwards • Result of the Wage-Price Spiral
Wage-Price Spiral: • A vicious cycle in which rising prices drive up wages and then rising wages drive up prices. The result is an inflationary spiral that can be hard to break.
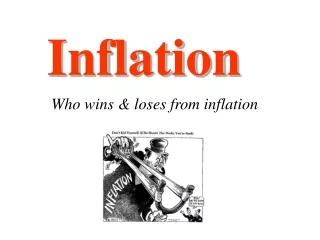
Biggest losers!!!(People most hurt by inflation) People on a fixed income Retired As Inflation ↑, Purchasing Power ↓
Biggest WINNERs!!!(People least affected by inflation) Borrowers (paying back loans with devalued money) Homeowners As inflation ↑, these people see their “wealth” increase!
Let’s practice looking at some data… During which of these years was the inflation rate the lowest? The highest?
Let’s practice looking at some data… Based on what you know about the inflation rate and how it’s determined, what might explain the deflation before 1933?
Let’s practice looking at some data… What might explain the fluctuations between 1933 and 1940?
Let’s practice looking at some data… • What might explain the increase in inflation after 1940?
Based on these data, what generalizations can you make about the health of the U.S. economy during the Great Depression? How do the inflation rate data help to explain what you see in the photograph?