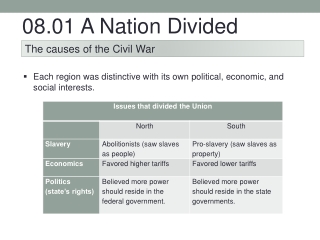
Understanding GDP: The Measure of Economic Activity
280 likes | 404 Vues
Gross Domestic Product (GDP) is a key indicator of a nation's economic performance, representing the market value of all final goods and services produced over a specific period. This guide explains how GDP is calculated using examples, the distinction between final and intermediate goods, and the significance of using current vs. constant prices. It also discusses GDP measurement alternatives, such as the expenditure approach, and emphasizes the importance of assessing real GDP to account for inflation. Understanding GDP is crucial for evaluating economic health and making informed comparisons across countries.

Understanding GDP: The Measure of Economic Activity
E N D
Presentation Transcript
Measuring a nation’s output • Having a number that summarizes the level of economic activity is clearly convenient • Alternative would be to see how much of each type of good is available • But then it is hard to compare • One year output is 2 apples, 2 bananas • Next year 3.5 apples, 1 banana • Did output go up or down? Not clear!!
Gross domestic product • Most frequently used measure of an economy’s output • Definition: GDP is the market value of the final goods and services produced in a country during a given period
Computing GDP (Example) The GDP produced in a typical night in SoBe • 100 people go to a nightclub (cover is $20 each) • 100 go to the new world orchestra ($40 dlls per ticket) • 300 rolls of sushi are prepared ($15 per roll) • 50 gallons of orange juice are consumed ($5 per gallon)
A typical night at southbeach 100 nightclub (times $20) 100 orchestra (times $40) 300 rolls of sushi (times $15) 50 gallons of OJ (times $5) $2000 +$4000 +$4500 +$ 250 GDP=$10750 Computing GDP (Example) Remark: GDP is a sum of quantities weighted by price
Important remarks • When computing GDP more expensive items receive a higher weight than cheaper ones • Is that reasonable? • Idea behind it: Amount people are willing to pay is an indication of the benefit they receive
Important remarks (2) • Only final goods are counted in GDP • We did not include (to name a few) • The DJ wages paid by the nightclub • The wages of the musicians of the orchestra • The ingredients needed for sushi: Fish, rice, wasabi • Oranges purchased to prepare OJ
Definitions: Final vs intermediate goods • A final good is the end product of a process and it is the good or service that consumers actually use • The goods or services produced on the way towards making the final product are called intermediate
Why GDP includes only final goods? • If we computed GDP by adding market value of final + intermediate goods we would be double counting • Oranges (intermediate good) are purchased to produce juice (final good) and the final good price includes the cost of the necessary inputs to produce it
Computing GDP is rather complicated and costly! • A list of each final good produced during the year is required (together with prices). • It is mathematically simple, but the amount of information required is huge • Is there any alternative way?
The expenditure method for measuring GDP • Any good or service that is produced will also be purchased and used by some economic agent • The 4 economic agents considered in national accounts are: • Households • Firms • Government • Foreign sector
Expenditure method (contd) • Note: Amounts that purchasers spend on various goods and services is equal to the market value of those goods
GDP can be measured with equal accuracy by either of two methods: • Adding up the market value of all goods and services that are domestically produced • Adding up the total amount spent by each of the four groups on final goods and services, and subtracting spending on imported goods & services (output) GDP=C+I+G+X-M (total expenditure)
What economists mean by investment • Investment is spending by firms on new factories, office buildings, machinery, and inventories and spending by households on new houses. Improvements on existing structures are also included. • Buying stocks only changes ownership and does not add to GDP (this type of financial expenditure is not investment in economics)
The need for computing “real” GDP • Economists like making time comparisons of aggregate data to see “how the economy is performing” • Near elections a president would like saying that the economy grew during her/his term
Measured by GDP Mexico and Angola grow much faster than the US
Year: 2002 Goods produced 10 Microsoft office 2000 ($100 each) 2 Pentium 4 ($2000 each) GDP = 10*100+2*2000=$5000 Year: 2003 Goods produced 10 Microsoft office 2000 ($200 each) 2 Pentium 4 ($4000 each) GDP = 10*200+2*4000=$10,000 What is going on then?Consider the following hypothetical economy The quantities of goods and services produced are the same, yet, GDP doubled. Why?
We need to exclude the effects of price changes!!!!! • How to do it? • Standard approach is to use a common set of prices to value quantities produced in different years • One picks a particular year, called base year, and uses the prices for that year to calculate the market value of output for all other years
Step 1. Set the base year Year: 2002 Goods produced 10 Microsoft office 2000 ($100 each) 2 Pentium 4 ($2000 each) Real GDP = Compute Real GDP for our example • Year: 2003 Goods produced • 10 Microsoft office 2000 ($200 each) • 2 Pentium 4 ($4000 each) Real GDP =
How to make cross-country income comparisons? • Each country reports GDP in terms of their local currency • How can we compare incomes across countries?
Illustrative Example Suppose all countries produce, each year, one good: a big-mac If GDP measures the quantity of goods and services produced by each given country, any sensible measure of GDP in this example should say all countries have the same GDP
GDP in dollars is extremely different across countries!!! Source: The economist’s big mac index
What is going on?, How to construct comparable GDP figures? • A dollar has very different purchasing power across countries • In other words, relative prices vary a lot across the world • When making cross country comparisons use PPP adjusted measures • Method (in simple terms): Use one country’s prices to compute the GDP of all other countries
Measuring Economic Growth • The economic growth rate is the percentage change in the quantity of goods and services produced from one year to the next. • Growth year 2004: (GDP2004-GDP2003)/GDP2003 - 1
GDP vs Welfare • Real GDP is not a perfect measure of economic welfare because: • 1. Quality improvements tend to be neglected in calculating real GDP so the inflation rate is overstated and real GDP understated. • 2. Real GDP does not include household production, that is, productive activities done in and around the house by members of the household.
GDP vs Welfare • 3. Real GDP, as measured, omits the underground economy, which is illegal economic activity or legal economic activity that goes unreported for tax avoidance reasons. • 4. Health and life expectancy are not directly included in real GDP. • 5. Leisure time, a valuable component of an individual’s welfare, is not included in real GDP. • 6. Environmental damage is not deducted from real GDP. • 7. Political freedom and social justice are not included in real GDP.