THE RELATIONSHIP BETWEEN VOLCANIC AND SEISMIC ACTIVITY
10 likes | 165 Vues
EGU General Assembly 2012 , Vienna , April 22 – 27, 201 2. THE RELATIONSHIP BETWEEN VOLCANIC AND SEISMIC ACTIVITY. Kalenda P. 1) and Neumann L. 2 )

THE RELATIONSHIP BETWEEN VOLCANIC AND SEISMIC ACTIVITY
E N D
Presentation Transcript
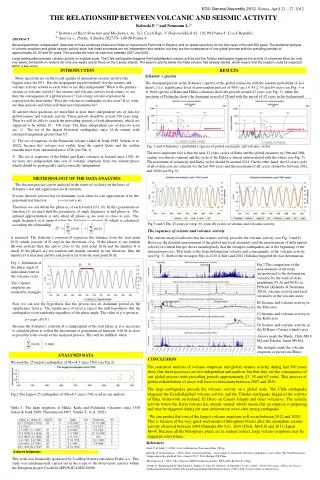
EGU General Assembly 2012, Vienna, April 22 – 27, 2012. THE RELATIONSHIP BETWEEN VOLCANIC AND SEISMIC ACTIVITY Kalenda P. 1) and Neumann L.2) 1)Institute of Rock Structure and Mechanics, Ac. Sci. Czech Rep., V Holešovičkách 41,182 09 Praha 8, Czech Republic 2)Anect a.s., Praha, A.Staška 2027/79, 140 00 Praha 4 ABSTRACT We analysed three “independent” data sets of three volcanoes (Katla and Hekla on Iceland and Pichincha inEquator) and the global seismicity for the time span of the last 500 years.The statistical analysis of volcano eruptions and global seismic activity show that these processes are notindependent and random, but they are the consequence of one global process with the prevailing periods ofapproximately 43, 53 and 63 years. This process will have its maximum between 2007 and 2020. Large earthquakes precede volcanic activity on a global scale. The Chile earthquake triggered theEyjafjallajökull volcano activity and the Tohoku earthquake triggered the activity of volcanoes Etna (for only oneweek), Grímsvötn on Iceland (for only one week) and El Hiero on the Canary Islands. The seismic activity belowthe Katla volcano had already started, which means that the eruption could be expected within a few years. INTRODUCTION RESULTS Schuster´s spectra The dominant periods in the Schuster´s spectra of the global seismicity with the random probability of less than 0,1 (i.e. significance level of non-random process of 90%) are 14, 43.2, 53 and 64 years (see Fig. 3 or 4). Both spectra of Katla and Hekla volcanoes show the periods around 43 years (see Fig. 3), while the spectrum of Pichincha shows the dominant period of 28 and with the period of 42 years in the background. Many questions are on the recent agenda of anomalous seismic activity (the biggest since the 60s).Has the megaquake period finished? Are the seismic and volcanic activity related to each other or are they independent? What is the primary – seismic or volcanic activity? Are seismic and volcanic activity local events, or are they the consequence of a global process? Can a large volcano explosion be expected in the near future? Does the volcano or earthquake cycles exist? If so, what are their periods and when will their next maximums be? To answer these questions we must find at least three independent sets of data for global seismic and volcanic activity.These periods should be at least 500 years long. Then we will be able to search the prevailing periods of both phenomena, which are supposed to be within 10 – 300 years. The three independent sets of data we used are: 1)The set of the largest historical earthquakes since 16-th century with estimated magnitude greater than 8.5. 2) The set of eruptions of the Pichincha volcano(Jakeš & Jeník 1989, Venzke et al. 2002), because this volcano was visible from the capitol Quito and the written remarks have been chronicled since 1526 (see Tab 1). 3) The set of eruptions of the Hekla and Katla volcanos in Iceland since 1510. So we have two independent data sets of volcanic eruptions from two distant places which should be geologically and tectonically independent. Fig. 3 and 4 Schuster´s probability spectra of global seismicity and volcanic cycles The most important fact is that the near43 years cycles of Katla and the global seismcity in 19th and 20th century are almost coherent and the cycle of the Hekla is almost anticorrelated with the others (see Fig. 5). The maximum of seismicity and Katla cycles should be around 2014. On the other hand, the 63-years cycle of all of data sets are coherent for the last 400 years and the maximum of all cycles should be between 2012 and 2020 (see Fig. 6). METHODOLOGY OF THE DATA ANALYSES The discrete process can be analysed in the terms of cyclicity on the basis of Schuster´s test and significance level criterion. If some discrete process has its dominant cycle, then we can approximate it by the goniometrical functiony = cos (t+ ). Therefore we can define the phase i of each event i (i=1..N). In this goniometrical function (1) we must find the parameters of angle frequency and phase . The optimal approximation is only when all phases iare zero or close to zero. The angle frequency is optimal when the Schuster’s criterion D, which is calculated according the relationship Fig.5 and 6 The 43-years A) resp. 63-years B) cycles of seismic and volcanic activity The sequence of seismic and volcanic activity The statistic analysis indicates that the seismic activity precedes the volcanic activity (see Fig. 5 and 6).However, the detailed measurement of the global and local seismicity and the measurement of deformation velocity in Central Europe shows unambigously that the strongest earthquakes are at the beginning of the relaxation process.This leads to the large deformation velocity and, consequently, to the volcanic activity (see Fig. 7). Both of the strongest EQs in 2010 (Chile) and 2011 (Tohoku) triggered the fast deformation process. is maximal. The Schuster’s criterion D expresses the distance from the start point [0,0], which consists of N steps in the directions of i. If the phases i are random (Brown motion) then the end is close to the start point [0,0] and the number D is small. If the phases are not random and mainly oriented in one direction, then the number D is maximal and the end point is far from the start point [0,0]. Fig.1. Definition of the phase angle of individual event in the volcanic cycle. The volcanic eruptions are marked by triangles. Fig.7 The comparison of the measurement of tilt noise (proportional to the deformation velocity) by the vertical static pendulums P1 A) and P6 E) in Příbram (Kalenda & Neumann2010), volcanic activity and local seismicity in the volcano areas: B) Seismic and volcanic activity in the Etna area C) Seismic and volcanic activity in the Katla area D) Seismic and volcanic activity in the El Hiero (Canary islands) area Arrows mark the Maule, Chile M8.8 EQ and Tohoku, Japan M9 EQ. The triangles mark the volcanic eruptions or paroxysm (Etna). Now we can test the hypothesis that the process has its dominant period on the significance level p. The significance of level p rejects the null hypothesis that the earthquakes occur randomly regardless of the phase angle. The value of p is given as p = exp( -D2/N ). Because the Schuster’s criterion D is independent of the start phase , it is necessary to calculate phase so that the maximums of goniometrical function will be as close as possible to the events of the analyzed process. This will be fulfilled, when ANALYSED DATA CONCLUSION The statistical analysis of volcano eruptions and global seismic activity during last 500 years show that these processes are not independent and random, but that they are the consequence of one global process with prevailing periods approximately 43, 53 and 63 years. This process of global redistribution of stress will have its maximum between 2007 and 2020. The large earthquakes precede the volcanic activity on a global scale. The Chile earthquake triggered the Eyjafjallajökull volcano activity and the Tohoku earthquake triggered the activity of Etna, Grímsvötn on Iceland, El Hiero on Canary Islands and other volcanoes. The seismic activity below the Katla volcano has already started, which means that an eruption is preparing and may be triggered during the next deformation wave after strong earthquake. We can predict that one of the largest volcano eruptions will occur between 2012 and 2020.This is because of the very quick movement of lithosphere blocks after the anomalous seismic activity observed between 2004 (Sumatra M= 9.2), 2010 (Chile M=8.8) and 2011 (Japan M=9). Because all the lithosphere plates are in mutual contact,large volcano eruptions may be triggered everywhere. We used the 25 largest earthquakes of M>=8.5 since 1500 (see Fig 2). Fig.2 The largest 25 earthquakes of M>=8.5 since 1500, used in our analysis Table 1: The large eruptions of Hekla, Katla and Pichincha volcanoes since 1500 (Jakeš & Jeník1989, Thorarinsson1967, Venzke E. et al. 2002). References Jakeš. P. & Jeník. J. (1989): Cesty za Hefaistem. Panorama Praha. 280 pp. Kalenda. P. & Neumann. L. (2010): Static vertical pendulum – observations of anomalous tilt before earthquakes (case study). The 5th International Symposium on In-situ Rock Stress August 25-27. 2010. Beijing. P.R.China. Thorarinsson. S. (1967): The eruptions of Hekla in historical times. H.F.Leiftur. Reykjavik. 183pp. Venzke E. Wunderman R W. McClelland L. Simkin. T. Luhr. J F. Siebert L. & Mayberry G (eds.) (2002-). Global Volcanism. 1968 to the Present. Smithsonian Institution. Global Volcanism Program Digital Information Series. GVP-4 (http://www.volcano.si.edu/reports/). Acknowledgment This work was financially sponsored by CoalExp Ostrava and Anect Praha, a.s.. This study was simultaneously carried out in the scope of the observatory activity within the European project CzechGeo/EPOS-ID LM2010008.