Download
1 / 50
500 likes | 667 Vues
GOLD PRICES December 2000 to September 2011. US$1 771. US$ per Ounce. | 2001 | 2002 | 2003 | 2004 | 2005 | 2006 | 2007 | 2008 | 2009 | 2010 | 2011. Robertson Economic Information Services. GOLD PRICES December 2000 to October 28 2011. US$1 741. US$ per Ounce.

E N D
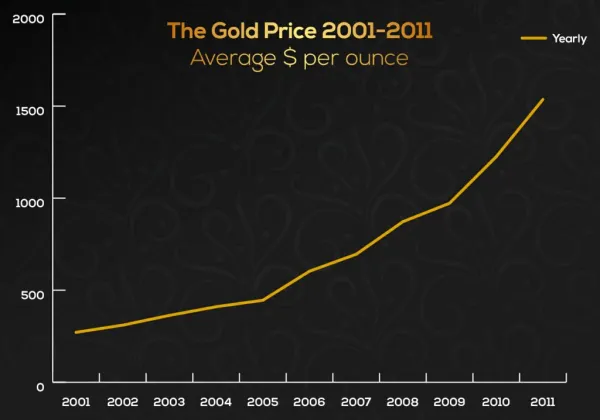
GOLD PRICESDecember 2000 to September 2011 US$1 771 US$ per Ounce | 2001 | 2002 | 2003 | 2004 | 2005 | 2006 | 2007 | 2008 | 2009 | 2010 | 2011 Robertson Economic Information Services
GOLD PRICESDecember 2000 to October 28 2011 US$1 741 US$ per Ounce | 2001 | 2002 | 2003 | 2004 | 2005 | 2006 | 2007 | 2008 | 2009 | 2010 | 2011 Robertson Economic Information Services
GOLD PRICESDecember 2000 to December 2011 Month-End Prices US$1 574 US$ per Ounce | 2001 | 2002 | 2003 | 2004 | 2005 | 2006 | 2007 | 2008 | 2009 | 2010 | 2011 Robertson Economic Information Services
GOLD PRODUCTION VOLUMES KILOGRAMS PER YEAR Robertson Economic Information Services
GOLD PRODUCTION VOLUMES FIRST 8 MONTHS 2011 KILOGRAMS PER YEAR Robertson Economic Information Services
MINING PRODUCTION PLATINUM KILOGRAMS Robertson Economic Information Services
MINING PRODUCTION PLATINUM FIRST 8 MONTHS 2011 KILOGRAMS Robertson Economic Information Services
MINING PRODUCTION PALLADIUM KILOGRAMS Robertson Economic Information Services
MINING PRODUCTION RHODIUM KILOGRAMS Robertson Economic Information Services
MINING PRODUCTION VOLUMES TONNES Robertson Economic Information Services
MINING PRODUCTION VOLUMES - BASE MINERALS TONNES Robertson Economic Information Services
COAL PRODUCTION Tonnes per Month - Jan 1996 to Aug 2011 | 1996 | 1997 | 1998 | 1999 | 2000 | 2001 | 2002 | 2003 | 2004 | 2005 | 2006 | 2007 | 2008 | 2009 | 2010 | 2011 To August 2011 Robertson Economic Information Services
HWANGE COLLIERYImproving Performance First six months 2011 2010 Coal sales, millions of tonnes 1,16 1,18 Coking coal, tonnes 364 000 319 159 Revenue US$’m 48,6 45,2 ------------------------------------------------------------- US$180 million needed to update underground and opencast mining operations Robertson Economic Information Services
COAL PRODUCTION Tonnes per Month - Jan 1996 to Aug 2011 | 1996 | 1997 | 1998 | 1999 | 2000 | 2001 | 2002 | 2003 | 2004 | 2005 | 2006 | 2007 | 2008 | 2009 | 2010 | 2011 Robertson Economic Information Services
MINING PRODUCTION HIGH CARBON FERROCHROME TONNES Robertson Economic Information Services
MINING PRODUCTION NICKEL TONNES PER YEAR Robertson Economic Information Services
MINING PRODUCTION COPPER TONNES PER YEAR Robertson Economic Information Services
MINING PRODUCTION COBALT TONNES
MINING PRODUCTION IRON ORE TONNES Robertson Economic Information Services
MINING PRODUCTION PHOSPHATE ROCK TONNES PER YEAR Robertson Economic Information Services
ASBESTOS PRODUCTION VOLUMES TONNES Robertson Economic Information Services
MINING PRODUCTION IRON ORE TONNES Robertson Economic Information Services
MINING PRODUCTION IRON ORE TONNES Robertson Economic Information Services
ZISCO STEEL SALES TONNES PER MONTH 2000 FIRST MERCHANT BANK
COMMODITY PRICESINDEX: DEC 2006=100 INDEX: December 2006=100 || 2007 | 2008 | 2009 | 2010 | 2011 |
PLATINUM PRICES 2011 2010 2012 US$ per Ounce | Jan | Feb | Mar | Apr | May | Jun | Jul | Aug | Sep | Oct | Nov | Dec | Robertson Economic Information Services
GOLD & PLATINUM PRICES PLATINUM GOLD US$ per Ounce | Jan | Feb | Mar | Apr | May | Jun | Jul | Aug | Sep | Oct | Nov | Dec | 2011 Robertson Economic Information Services
PALLADIUM PRICES 2011 US$ per Ounce 2010 | Jan | Feb | Mar | Apr | May | Jun | Jul | Aug | Sep | Oct | Nov | Dec | Robertson Economic Information Services
GOLD PRICES 2012 2011 US$ per Ounce 2010 | Jan | Feb | Mar | Apr | May | Jun | Jul | Aug | Sep | Oct | Nov | Dec | Robertson Economic Information Services
MINING PRODUCTION VOLUMES TONNES Robertson Economic Information Services
MINING PRODUCTION VOLUMES – PRECIOUS METALS KILOGRAMS Robertson Economic Information Services
RESOURCE CONVERSION:Sales Revenue becomes Payments for Goods and Services needed to extract Minerals. Profits are made only if Revenue from the Mineral Sales exceeds Costs COSTS AFTER VERY LARGE CAPITAL OUTLAY
RESOURCE CONVERSION:Sales Revenue becomes Payments for Goods and Services needed to extract Minerals. Profits are made only if Revenue from the Mineral Sales exceeds Costs COSTS AFTER VERY LARGE CAPITAL OUTLAY ARE INCREASED BY ADDITION OF ROYALTIES
RESOURCE CONVERSION:Sales Revenue becomes Payments for Goods and Services needed to extract Minerals. Profits are made only if Revenue from the Mineral Sales exceeds Costs COSTS & REVENUE Value of minerals produced Revenue exceeds costs = Profit ROYALTIES CALCULATED AS A % OF TOTAL VALUE OF MINERALS PRODUCED
RESOURCE CONVERSION:Sales Revenue becomes Payments for Goods and Services needed to extract Minerals. Profits are made only if Revenue from the Mineral Sales exceeds Costs COSTS & REVENUE Value of minerals produced Revenue exceeds costs = Profit …but after downturn in metal prices Costs exceed revenue = Loss ROYALTIES CALCULATED AS A % OF TOTAL VALUE OF MINERALS PRODUCED
RESOURCE CONVERSION:Sales Revenue becomes Payments for Goods and Services needed to extract Minerals. Profits are made only if Revenue from the Mineral Sales exceeds Costs COSTS & REVENUE Value of minerals produced Revenue exceeds costs = Profit Costs exceed revenue Loss
RESOURCE CONVERSION:Sales Revenue becomes Payments for Goods and Services needed to extract Minerals. Profits are made only if Revenue from the Mineral Sales exceeds Costs COSTS & REVENUE Value of minerals produced Revenue exceeds costs = Profit Costs exceed revenue Loss Mining company’s entire investment is to earn this profit
RESOURCE CONVERSION:Sales Revenue becomes Payments for Goods and Services needed to extract Minerals. Profits are made only if Revenue from the Mineral Sales exceeds Costs COSTS & REVENUE Profit Value of minerals produced Revenue exceeds costs …but after downturn in metal prices Costs exceed revenue Loss
RESOURCE CONVERSION:Sales Revenue becomes Payments for Goods and Services needed to extract Minerals. Profits are made only if Revenue from the Mineral Sales exceeds Costs COSTS & REVENUE Profit Value of minerals produced Revenue exceeds costs …but after downturn in metal prices Costs exceed revenue Loss This profit not be sufficient to justify the mining company’s investment
RESOURCE CONVERSION:Sales Revenue becomes Payments for Goods and Services needed to extract Minerals. Profits are made only if Revenue from the Mineral Sales exceeds Costs COSTS & REVENUE Profit Value of minerals produced Revenue exceeds costs Costs exceed revenue Loss If metal prices fall, company’s investment could experience loss
DIAMOND REVENUES 2011US$122 256 491 US$’000 | Jan | Feb | Mar | Apr | May | Jun | Jul | Aug | Sep | Oct | Nov | Dec |
CHIADZWA DIAMONDS African Consolidated Resources Claim
CHIADZWA DIAMONDS Mbada Diamonds Marange Resources ZMDC Marange Resources
CHIADZWA DIAMONDS Mbada Diamonds Marange Resources ZMDC Marange Resources
CHIADZWA DIAMONDS CIO Mbada Diamonds POLICE ARMY Marange Resources ZMDC Marange Resources PRISONS ANJIN
CHIADZWA DIAMONDS CIO Mbada Diamonds US$600mm POLICE ARMY Marange Resources ZMDC Marange Resources PRISONS ANJIN
CHIADZWA DIAMONDS CIO Mbada Diamonds US$600mm POLICE $? $? $? Marange Resources ZMDC ARMY Marange Resources PRISONS $? $? ANJIN