Download
1 / 43
460 likes | 705 Vues
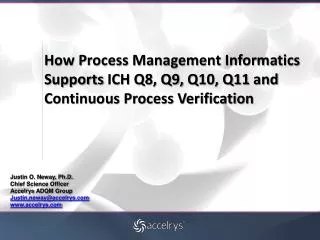
How Process Management Informatics Supports ICH Q8, Q9, Q10, Q11 and Continuous Process Verification. Justin O. Neway, Ph.D. Chief Science Officer Accelrys ADQM Group Justin.neway@accelrys.com www.accelrys.com. What is Process Management Informatics ?.

E N D
How Process Management InformaticsSupports ICH Q8, Q9, Q10, Q11 andContinuous Process Verification Justin O. Neway, Ph.D. Chief Science Officer Accelrys ADQM Group Justin.neway@accelrys.com www.accelrys.com
What is Process Management Informatics? The informatics capabilitiesneeded to design, commercialize and sustain robust manufacturing processes that give predictable, high quality outcomes cost-effectively, based on scientific process understanding.
The need for Process Management Informatics comes from the ICH Q8, Q9, Q10, Q11 docs andFDA Validation Guidance
From ICH Q8 (&Q11) Pharmaceutical Development • Process Understanding used to design processes with reduced variability • Design Space allows “regulatory flexibility” • Risk-based regulatory decisions • Manufacturing process improvements within design space • Reduction of post-approval submissions • Real-time quality control – reduced release testing “It should be recognized that the level of knowledge gained, and not the volume of data, provides the basis for science-based submissions and their regulatory evaluation.”
From ICH Q9 Quality Risk Management • Definition of risk (occurrence and severity) • Organizational aspects of risk management • Risk Assessment, Control and Review • Risk Identification, Analysis and Evaluation • Risk management methodology & tools “Once a quality risk management process has been initiated, that process should continue to be utilized for events that might impact the original quality risk management decision, whether these events are planned (e.g., results of product review, inspections, audits, change control) or unplanned (e.g., root cause from failure investigations, recall).”
From ICH Q10 Pharmaceutical Quality System • Elements of the lifecycle approach: • Process performance and product quality monitoring system • Corrective action and preventive action (CAPA) system • Change management system • Management review of process performance & product quality • The need for Knowledge Management “Sources of knowledge include, but are not limited to, prior knowledge […], pharmaceutical development studies, technology transfer activities, process validation studies over the product lifecycle, manufacturing experience, continual improvement and change management activities.”
Additional Regulatory Perspective “Process validation is defined as the collection and evaluation of data, from the process design stage throughout production, which establishes scientific evidence that a process is capable of consistently delivering quality products” Stage 3: Continued Process Verification: Ongoing assurance is gained during routine production that the process remains in a state of control Process Validation: General Principles and Practices, January, 2011
Regulatory Perspective “As a result of the “trend toward outsourcing,” FDA is paying closer attention to contract relationships. Sponsors “should expect to hear questions during inspections about how their companies are making sure that their CMOs are actually being monitored.” Richard Friedman, Director, FDA Office of Compliance Headline: “FDA Expected to Release Long-Awaited Guidance on CMO Agreements in 2013”
The Desired State: Enables by PMI Safe and Efficacious Products • Fast CMC Prep & Approval • Short Time to Market • High Yield and Quality • Low Process Variability • Acceptable Risks • Acceptable Process Economics AND all the Supporting Data and Institutionalized Knowledge Regardless of Geographic Location
COLLECTION Weekly Data Report (per Product) Continuous Historian JMP Script Single Point Code: Run it to update Batch Records Up Mfg Excel ~100 variables Control Charts/ Capability Multi point / Continuous Manual Update Excel Layout File Multi-Point / Continuous Trend Overlays Pur. Mfg Excel 200 variables Batch Records Chromatogram Overlays UNICORN (Continuous I/O) UNICORN “Evaluate” Traditional Approach #1 UPSTREAM DATA LIMS DATA (Release,..) PURIFICATION DATA
Weekly Data Report (per Product) Control Charts/ Capability Multi-Point / Continuous Trend Overlays Chromatogram Overlays Traditional Approach #1 COLLECTION UPSTREAM DATA Continuous Historian JMP Script Single Point Code: Run it to update Batch Records Up Mfg Excel ~100 variables LIMS DATA (Release,..) Multi point / Continuous Manual Update Excel Layout File Pur. Mfg Excel 200 variables Batch Records PURIFICATION DATA UNICORN (Continuous I/O) UNICORN “Evaluate”
COLLECTION Weekly Data Report (per Product) Continuous Historian JMP Script Single Point Code: Run it to update Batch Records Up Mfg Excel ~100 variables Control Charts/ Capability Multi point / Continuous Manual Update Multi-Point / Continuous Trend Overlays Pur. Mfg Excel 200 variables Batch Records Chromatogram Overlays UNICORN (Continuous I/O) UNICORN “Evaluate” Traditional Approach #1 Spreadsheet Madness COLLECTION UPSTREAM DATA Continuous Historian JMP Script Single Point Code: Run it to update Batch Records Up Mfg Excel ~100 variables LIMS DATA (Release,..) Multi point / Continuous Manual Update Excel Layout File Pur. Mfg Excel 200 variables Batch Records PURIFICATION DATA UNICORN (Continuous I/O) UNICORN “Evaluate”
Traditional Approach #2 Warehouse Madness
Requirements for PMI • Provide aself-service, on-demand data access platform for all process and quality data, includingpaper record data • Provide automated data contextualization for observational and investigational analysis and reporting • Provide access, analysis and reporting for all types of data, including continuous and discrete • Provide a validated system that delivers value for non-programmers and non-statisticians
Types of Process Data Discrete data • Measured once per batch • MES, EBR, LIMS, ERP, Paper, Others Continuous data • Strip charts – time series profiles • SCADA, Historians, DCS, PLC, Instruments Replicate data • Several measurements, same sample/time • MES, EBR, LIMS, Paper, Others Spectral data • Continuous data, discrete extracts and deconvolutions Event data • Batch, equipment records, SCADA, etc. Keyword and free text data • Enables records to be retrieved and understood
The ManufacturingData Collection Landscape Raw Materials Process Step 1 Process Step 2 Process Step 3 Process Steps… Final Product ERP LIMS HIST CAPA Nexus: Data Access, Aggregation & Recontextualization MES Eng Maint Paper Records
Context is King Context is the organization of related elements that enables analysis and interpretation Other examples of meaningful contexts for data analysis: • Data type context: enables specific types of data analyses • Batch context: enables batch-to-batch comparisons • Process context: enables process-to-process comparisons • Site context: enables site-to-site comparisons • Genealogy context: enables upstream / downstream correlations
S2 B3 ID S3 B2 ID S1 B1 ID S1 B2 ID S1 B3 ID S1 B2 ID S1 B4 ID S1 B2 ID S3 B1 ID S3 B1 ID S3 B5 ID S3 B2 ID S2 B1 ID S2 B1 ID S2 B3 ID S3 B6 ID S3 B5 ID S3 B6 ID S4 B1 ID S4 B2 ID S4 B2 ID S4 B1 ID S3 B3 ID S3 B3 ID S2 B2 ID S2 B2 ID S3 B4 ID S3 B4 ID S4 B3 ID S4 B3 ID Proportionating Genealogy for Correlating Upstream / Downstream • Process Step 1 Process Step 2 Process Step 3 Process Outcome
Paper Data Capture Data Sources Paper Records Sponsor Mfg. CMO Process Dev. Pilot Plant
Paper Data Capture Data Sources Paper Records Sponsor Mfg. CMO Process Dev. Pilot Plant
Excel Data Import Data Sources Excel Spreadsheets Sponsor Mfg. CMO Process Dev. Pilot Plant
Data Access and Contextualization Data Sources RIF Sponsor Mfg. LIMS CMO HIST HIST Dynamic Mapping Engine Process Dev. AG Analysis Group Pilot Plant
Data Access and Contextualization Data Sources RIF LIMS Sponsor Mfg. HIST CMO ERP HIST Dynamic Mapping Engine Process Dev. AG Analysis Group CAPA Pilot Plant MES SAP EG
Data Access and Contextualization Data Sources RIF LIMS Sponsor Mfg. HIST CMO ERP HIST Dynamic Mapping Engine Process Dev. AG Analysis Group CAPA Pilot Plant MES SAP EG
Data Access and Contextualization Data Sources RIF LIMS Sponsor Mfg. HIST CMO ERP HIST Dynamic Mapping Engine Process Dev. AG Analysis Group CAPA Pilot Plant MES SAP EG
Process Development Data Access Raw Materials Sponsor Mfg. Process Step 1 CMO Process Step 2 Process Step 3 HIST LIMS Process Steps… Process Dev. Final Product Nexus Pilot Plant
Using Data Within The System Trending, Alerting, Trouble-shooting, Plotting, Univariate & Multivariate Statistics, Fermentation, Chromatography, Stability, etc. Dynamic Mapping Engine AG Analysis Group
Additional Supported Applications Trending, Alerting, Trouble-shooting, Plotting, Univariate & Multivariate Statistics, Fermentation, Chromatography, Stability, etc. Templated Reports: CTD, CMC, APR, PQR, etc. Dashboard Displays: Web-based, Mobile, etc. Information Portals: Web-based, Sharepoint, etc. Dynamic Mapping Engine Specialized Analytics: Umetrics, JMP, Minitab, eChip, etc. AG Analysis Group ODBC
Accelrys Discoverant: The Enabling Capability for Enabling Effective Collaboration
Sponsor has Accelrys Disocverant:PRIMR Input and Spreadsheet Import
Sponsor has Accelrys Discoverant:Live Link to Sponsor Data HIST PRIMR LIMS
Summary The desired state requires a supporting Process Management Informatics Capabilitythat includes an effective cure for “Spreadsheet Madness” • Self-service access to data from multiple disparate sources • Flexible, accurate capture of data from paper records • Automatic contextualization for specific types of analysis • Working with continuous and discrete data together • Domain-specific observational and investigational analytics • Automated analysis and reporting (e.g. Batch Reports, APRs, PQRs)
Examples of Accelrys Discoverant Users Life Sciences Manufacturers CMOs
Practical Experience Deploying Discoverant in Merck Serono: Experience, Successes and Challenges Yves Bertozoz and Damien Voisard, Merck Serono, Vevey & Geneva, Switzerland Evolution of Discoverant Usage at Biogen Idec Andrew Lenz, Biogen Idec, Cambridge, MA Automation Optimized for Process Intelligence Joseph Shiminsky, BMS, Devens, MA Selection and Implementation of a Process Analysis System at Human Genome Sciences John Georger, Human Genome Sciences, Rockville, MD Links to the videos of these presentation are available on request
Thank youJustin O. Neway, Ph.D.Vice President and Chief Science OfficerAccelrys, ADQM Groupjustin.neway@accelrys.comhttp://www.accelrys.com+1-303-625-2102