Download
1 / 17
170 likes | 352 Vues
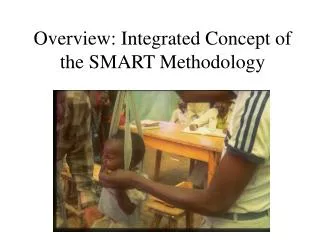
Overview: Integrated Concept of the SMART Methodology. Following the 2002 Washington DC meeting, it was decided that the SMART Version 1 Manual:. level of technical difficulty will be aimed primarily at PVOs; to be used by all humanitarian organisations, host countries.

E N D
Following the 2002 Washington DC meeting, it was decided that the SMART Version 1 Manual: • level of technical difficulty will be aimed primarily at PVOs; to be used by all humanitarian organisations, host countries. • scale will be determined by function of situation.
A Version 1 user should be able to estimate: • current and past trends in mortality. • current nutritional status of children under five. • the number of people in need of food, their location and characteristics e.g. displaced people, poor pastoralists. • the amount and quality of food they require. • how the needs of different groups are likely to evolve in future. in any humanitarian crisis
Humanitarian crisis • A humanitarian crisis includes any event (earthquake, flood, war, abnormal price change etc) which may compromise people’s access to food and other essential needs, such as to demand an exceptional response i.e. a situation which represents a significant deviation from the norm.
SMART Version 1 will be based on 3 main methods: • Nutritional status and mortality are basic indicators of the severity of a humanitarian crisis i.e. for identifying current need, prioritising resources, and monitoring the extent to which the relief system is meeting the needs of the population. • Food security information is needed to understand and interpret nutritional survey data. Taken together, these can meet the criteria set out. Other supporting information e.g. demographic, will be needed.
Nutritional status & food security information The manual will centre on nutritional status as this • is an objective measure • uses standardised methods • is already widely used by PVOs. Standard established indices (weight-for-height, oedema), and survey techniques will be used.
Anthropometric survey findings can be difficult to interpret. Even in a non-crisis year, in many locations: • There is a large seasonal variation in nutritional status. • The seasonal prevalence of malnutrition (including oedema) may be high.
The prevalence of malnutrition varies within and between years: Between years Seasonally within a year
Single nutrition surveys can be interpreted only • If comparable data is available from the same season in a previous non-crisis year. This is rare. • If the absolute values are extreme e.g. a malnutrition prevalence of 50%. and then only in terms of current nutritional status i.e. surveys cannot be used to predict how nutrition will evolve.
Nutrition trend data • Repeated estimates of nutritional status (and mortality) can give a trend, which is useful for monitoring change However, on its own trend data has no predictive power.
Food security information will be used to set nutrition survey results in context. Predicting how nutrition will evolve is critical to relief planning. Anthropometric findings (which are a proxy for low food intake) can be put in context if we understand: • people’s current ability to acquire food (including relief) • how people’s food access is likely to evolve in future.
Estimating food access A ‘livelihood’ approach will be used to triangulate nutritional survey (and mortality) findings. The basis of a ‘livelihood’ approach is to : • describe the non-crisis economy of the affected population. • estimate the impact of a shock on different parts (poor, better off) of the population. • predict the way in which people’s food access is likely to evolve.
The most widely used approach is the SC UK Household Economy Approach (HEA) However, this is ‘data heavy’ i.e. • it requires quantified data sets which take time and some skills to acquire. • uses a (simple) mathematical model to estimate current & future food access. An average PVO may have difficulty in combining standard HEA assessment with a nutrition survey.
HEA data: the surplus producing Lilongwe-Kasungu plain, Mchinji district, Malawi + livestock & other household assets + information for the population on wild foods, non-market redistribution
HEA can be used ‘lite’. • The basic data structure of HEA can be used: • obtaining information from ‘key informants’, avoiding primary data collection. • concentrating on the main features of an economy, avoiding detail.
The aim is to put together a ‘joined up story’ about: • What has happened e.g. flood, earthquake. • How this has affected people’s livelihoods & food access. • Their ability to cope with this, and the costs of coping. • Where nutrition survey findings fit in. • What types of external assistance are required, bearing in mind the practical constraints. Where the assumptions and uncertainties are clear.