Download
1 / 43
450 likes | 619 Vues
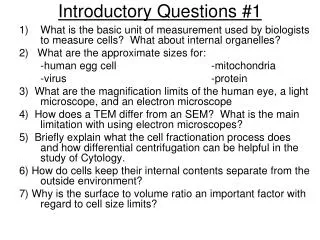
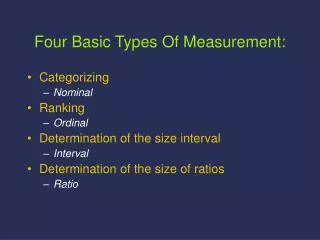
Four Basic Types Of Measurement:. Categorizing Nominal Ranking Ordinal Determination of the size interval Interval Determination of the size of ratios Ratio. CENTRAL TENDENCY AND VARIABILITY (NOMINAL SCALES). Information: guessing game (ESP experiments). Background:

E N D
Four Basic Types Of Measurement: • Categorizing • Nominal • Ranking • Ordinal • Determination of the size interval • Interval • Determination of the size of ratios • Ratio
CENTRAL TENDENCY AND VARIABILITY (NOMINAL SCALES) • Information: guessing game (ESP experiments) • Background: - Transmission of signals - How much is lost in channel? - How to measure the information transmitted in a message?
CENTRAL TENDENCY AND VARIABILITY (NOMINAL SCALES) One word - no guesses Two words - one guess Four words - two guesses Eight words - three guesses -# of guesses - power to which two needs to be raised to define # of words, or log to base 2 of # of alternatives -Number of guesses called # of bits (binary units)
Nominal scales: Name of category does not imply rank, even if it is a number.
Nominal Scales • Assignment to categories according to a rule • e. g., manic - depressive • paranoid - schizophrenic • involutional - melancholic • Starting point of science • Chemists - elements • Physicists - atoms and sub-atomic particles • Lineaus - biological categories • Freud - infantile sexuality - neurotic disorders • Modern Psychology • does it have reliable units of analysis? • Reflexes? • short term memory? • behavior disorders?
Frequency Distributions(Nominally Scaled Data) • Bar graph - histogram • Mode - summary statistic
Ordinal Scales - Numbers convey relative magnitude. • rank of one usually assigned to highest magnitude • can’t add or subtract ranks, e. g., ranks of weight Rank: Weight (lbs.) 1 200 2 20 3 3 4 2 5 .5
Ordinal Scales Summary Statistics: • Central Tendency:Median (as many observations above median as below it) • Variability:Range (difference between the smallest and highest values)
Interval scales: • Size of difference is known • Units are of equal size • Ratio scales: • True zero point exists • Multiplication or division possible
Magnitude of Psychological Judgments as a Function of Physical Intensity
CALCULATING THE MEAN Given the raw data: 2, 4, 6, 8, 10
Measures of Central Tendency in a Positively Skewed Distribution
Symmetrical Distributions Asymmetrical Distributions
Calculating Deviations from the MeanGiven the raw data: 2, 4, 6, 8, 10 Mean Deviation = Mean Absolute Deviation = Variance = Standard Deviation=
Calculating Deviations from the MeanGiven the raw data: 2, 4, 6, 8, 10 Mean Deviation = Mean Absolute Deviation = Variance = Standard Deviation=
MEASURING WITH THE STANDARD DEVIATION: Z-SCORES Given the raw data: 2, 4, 6, 8, 10
r = -1.0 Zy Zx r = +1.0 Zy Zx
Greater correlation over broad range of body weights Football linemen’s successes Little correlation within restricted range Body weight in pounds Effect of range on correlation
Relationship between r2 and Predicted Variance • Example: measures of rainfall and corn height • Suppose that r = 0.8. This means that 64% [(0.8)2] of the variance of the height of corn height is accounted for by knowledge of how much rain fell.
VALIDITY AND RELIABILITY • Reliability: To what extent will a test give the same set of results over repeated measurements? • Validity: To what extent does a test measure what it purports to measure? • Validity and reliability are measured as correlation coefficients.
Measuringreliability: • Odd-even or split-half method: To what extent does one half of the test agree with the items of the second half of the test? • Test-retest: Results of test is given on two different occasions are compared. Assumes that there are no practice effects • Alternative form: Where there is a practice effect, an alternative form of the original test is given and the results are compared. • A reliable test may not be valid. • A valid test must be reliable may not be valid. • A valid test must be reliable.
HERITABILITY • Heritability: The proportion of variance of a phenotype that is attributable to genetic variance. • Phenotype: Observable trait • Genotype: What is transmitted from generation to generation • What % of a phenotype is genetic? • Heritability is calculated by determining phenotypic variance and the magnitudes of its two components (genetic and environmental variance)
Calculation of Heritability 2 2 G E 1 + = 2 2 P P 2 G h2 = (h2 > 0 < 1) Heritability = 2 P Heritability: The proportion of variance of a phenotype that is attributable to genetic variance. 2p = 2g + 2e
Heritability does not apply to individuals! Example: h2 of IQ = 0.6. This does not mean that 60% of an individual’s IQ is genetic and 40% is environmental.
Heritability is Specific to the Population in which it’s Measured
2 P Minimum & maximum values of h (coefficient of heritability): 2 G h2 (h2 > 0 < 1) = h = 0.00: None of the observed values of phenotype is due to genes (all of it is due to environmental differences). h =1.00: All of variance is due to genes.
Heritability • …does not measure how much of a given person’s intelligence (say) is due to genes • This is impossible to quantify • Heritability measures how much variability in a trait is explained by variability in genes • …appears not to account for group differences in intelligence
Examples Of Heritability Coefficients: • Piebald Holstein Cow: • h2= .95 (color) • h2 = .3 (milk production) • Pigs: h2 = .55 (body fat) h2 = .15 (litter size) h2 is specific to the environment and population studied.
Heritably estimates are specific to populations and environments in which they are measured! Example 1: Heritability of skin color in Norway and the United States.It’s higher in the United States. Why? Because, in Norway the environment contributes more to phenotypic variation than family background. In the United States family background contributes more to variation in skin color then the environment.
Heritably estimates are specific to populations and environments in which they are measured! Example 2: Heritability of Tuberculosis.Decreased during the 20th century because of changes in the environment. Up to and during the 19th century, everyone who was exposed to germ got sick if they were susceptible. Improved hygiene made it less likely that genetically disposed individuals will get TB. Thus, heritability of TB decreased as environmental diversity increased.
How to Reduce h21. Interbreed - this reduces 2g2. Increase 2e. How to Increase h21. outcrossing - new genes2. mutation - new genes3. select for rare characteristics4. reduce 2e.