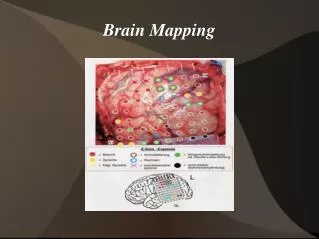
Mapping Sensory Stimulation and Brain Activation Patterns
Mapping Sensory Stimulation and Brain Activation Patterns. Sennay Ghebreab. Informatics Institute, Faculty of Science University of Amsterdam, The Netherlands. Overview. Current S-A mappings Brain reading competition Advanced S-A mappings. Background. What and how to map?.

Mapping Sensory Stimulation and Brain Activation Patterns
E N D
Presentation Transcript
Mapping Sensory Stimulation and Brain Activation Patterns Sennay Ghebreab Informatics Institute, Faculty of Science University of Amsterdam, The Netherlands
Overview • Current S-A mappings • Brain reading competition • Advanced S-A mappings
Background What and how to map? (Moving) Pictures fMRI Sensory Stimulation Brain Activation
Current S-A mappings Informatics Institute First-level (subject) analysis Anatomical Reference Design Matrix Spatial Normalization HRF Convolution Smoothing Motion Correction GLM Fitting Visualization Statistical Inference fMRI Subject n Parameter Estimates fMRI Subject 1 Visualization Statistical Inference GLM Fitting Higher-level (group) analysis fMRI Subject N Parameter Estimates Design Matrix
Current S-A mappings Example: inhibition-activation video study from CSCA Design fMRI session (within subjects) order 1:A-B N= neutral; S=sport; E=erotic; I=Inhibition order 2:B-A Subjective report Informatics Institute
Current S-A mappings Example: CSCA video study Erot 1 Erot 2 Sport 2 Sport 1 Neutral b1 b2 b3 b4 b5 = ´ + time = ´ X + Y b e
Current S-A mappings T = varianceestimate Example: CSCA video study 1 0 -1 0 0 b1 b2 b3 b4 b5 = Copes ´ 2.3 Z-statistic Copes 13.7 P < 0.05
Current S-A mappings Observation • Scene content only considered at meta-level (entire picture/movie is single condition, contrasted against e.g.rest state) • fMRI content not fully exploited (linearity, univariate methods, little non-linearity, multivariate methods) Meta-data fMRI Analysis Summary What: meta-data (conditions) How: GLM, design matrix (Moving) Pictures fMRI Sensory Stimulation Brain Activation
Brain reading competition Goal • To advance understanding of how the brain encodes, represents, and operates on dynamic sensory experience • To bring together researchers from cognitive science and computer science to accelerate developments in their respective research fields Organizers (Human Brain Mapping Organization) • University of Pittsburgh: W. Schneider, G. Siegle • Max Planck Institute for Biological Cybernetics: A. Bartels • Maastricht University: E. Formisano, R. Goebel • Carnegie Mellon University: T. Mitchell • University of Michigan: T. Nichols • Princeton University: J. Haxby • New York University & Weizmann Institute: U. Hasson
Brain reading competition Idea Analysis of brain activation patterns to characterize what an observer experienced while watching a video (e.g., was there a face in the video? who was it? was someone speaking? was the event pleasant? how attentive was the viewer?) Data (freely available) • 2/3 movies (HI tv series, 20 minutes, recurring scenes > 3 secs) • 3 subject’s fMRI (34x64x64x860 (TR=1.75s)) • 3x3 manual feature ratings (13 features every second) • Eye movement data (x,y, pupil 3x9000 (0.016s))
Brain reading competition Beta Activation Feature For 3 subject fmri’s and 2 movie feature ratings, calculate for each feature the betas to linearly predict feature strength from activation n – number of time points k – number brain areas = Learning
Brain reading competition ? Drawings by: Sue Schneider Reading ? ? ? ? ? Predict what subjects are experiencing or fixating on
Brain reading competition Example: decoding brain states, T. Michtell Predicting from fMRI data whether words read by subject are about tools, buildings, food, or other semantic categories. The trained classifier is reported to be 90% accurate
Brain reading competition Observation • Feature ratings are qualitative, incomplete andmovie-dependent • Some scene content addressed, but a lot more remains unaddressed • Within GLM framework and mainly oriented at data minning Scene Features fMRI Analysis Summary What: qualitative features How: GLM, design matrix (Moving) Pictures fMRI Sensory Stimulation Brain Activation
Advanced S-A mappings Person (shape, motion features) Grass (color, texture features) Water (color, texture features) Wakeboard movie from CSCA video Is it possible to approximately reconstruct any observed movie from fMRI purely on the basis of computer-generated generic natural scene descriptors?
Advanced S-A mappings Simple example: scene content analysis (1st order statistics) • Gaussian distribution of intensity red, green, blue components • Weibull distribution of intensity, red-green, blue yellow components (invariant features) time Average Green image Wakeboard movie from CSCA video Time (60 seconds)
Advanced S-A mappings Simple example: content analysis (higher-order statistics) • Principal component analysis over pixel time-series (pca over 352*240 curves) • Independent component analysis over pixel time-series time ICA1 Wakeboard movie from CSCA video Time (60 seconds)
Advanced S-A mappings Simple example: : fmri content analysis (univariate) • ICA’s as GLM regressors • 3- contrasts • P < 0.05 • Z-statistics • Group analysis (N=4 subjects watching same wakeboard video fragment under different instructions) 2.3 Z-statistic 7.4 Group average
Advanced S-A mappings Simple example: fmri content analysis (multivariate) • First principal component analysis of fMRI • Then probabilistic independent component analysis on pca results ICA fmri Cross-correlations Group average ICA movie
Discussion What to map • Numerous quantitative features, both for scene data and fmri data • Data reduction, scene decomposition, feature selection etc are crucial • What (sets of) quantitative features or hypotheses to address? How to map • Current S-A mapping approaches not optimized for functional data • Many similarities in analysis of scene data and fmri data (both functional) • What multivariate processing required to go beyond GLM framework?
Observations Integral handling of scene and fmri features? Content Analysis Scene Features fMRI Analysis V. (Moving) Pictures fMRI FD (Moving) Pictures fMRI Sensory Stimulation Brain Activation Sensory Stimulation Brain Activation