Download
1 / 13
130 likes | 496 Vues
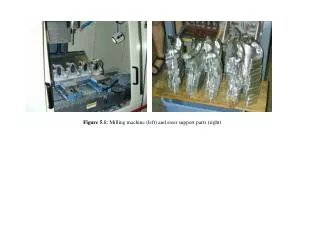
Figure 5.1: Milling machine (left) and steer support parts (right). Production cycle. Batch of 12. Production cycle. Batch of 60. Batch of 120. Batch of 300. Time [minutes]. 60. 240. 300. 120. 180. Produce steer supports (1 box corresponds to 12 units = 12 scooters).

E N D
Figure 5.1: Milling machine (left) and steer support parts (right)
Production cycle Batch of 12 Production cycle Batch of 60 Batch of 120 Batch of 300 Time [minutes] 60 240 300 120 180 Produce steer supports (1 box corresponds to 12 units = 12 scooters) Set-up from Ribs to Steer support Produce ribs (1 box corresponds to 24 units = 12 scooters) Set-up from steer support to ribs Figure 5.2: The impact of Set-up times on Capacity
Capacity 0.5 1/p 0.45 0.4 0.35 0.3 0.25 0.2 0.15 0.1 0.05 0 Batch Size 10 50 90 130 170 210 250 290 330 370 410 450 490 530 570 610 650 Figure 5.3.: Capacity as a function of the batch size
Inventory [in units of xootrs] 133 Steer support inventory Rib inventory 200 260 460 520 600 800 860 1060 1120 1200 1400 1460 Time [minutes] Production cycle Produce ribs Produce steer supports Idle time Set-up from Ribs to Steer support Set-up from steer support to ribs Figure 5.5: The impact of Set-up times on Capacity
Milling Machine Assembly process Set-up time, S 120 minutes - Per unit time, p 2 minutes/unit 3 minutes/unit Capacity (B=12) 0.0833 units/minute 0.33 units/minute Capacity (B=300) 0.4166 units/minute 0.33 units/minute Figure 5.6: Data from the scooter case about set-up times and batching
Capacity 0.5 1/p 0.45 0.4 0.35 Capacity of slowest step other than the one requiring set-up 0.3 0.25 0.2 0.15 0.1 0.05 0 Batch Size 10 50 90 130 170 210 250 290 330 370 410 450 490 530 570 610 650 Batch size is too small, process capacity could be increased (set-up step is at the bottleneck) Batch size is too large, could be reduced with no negative impact on process capacity (set-up is not at the bottleneck) Figure 5.7: Choosing a “good” batch size
Inventory Peak Inventory Inventory Time Production Deplete inventory Production cycle Inventory Time Shipment arrives Order cycle Figure 5.8: Different patterns of inventory levels
Cost per week C(Q) 90 80 70 Cost per week C(Q) 60 50 Inventory cost 40 30 Ordering fees 20 10 0 3000 4000 5000 6000 7000 8000 9000 Order quantity 10000 11000 12000 13000 14000 15000 16000 17000 Figure 5.9: Inventory and ordering costs for different order sizes
Inventory Imax Slope: 1/p-R Slope: -R Time T1 T2 T Figure 4.10: Inventory trajectory for the case of internal production
Extraction Filtering Bottling Set-up time, S - Requires a 30 min. down-time followingevery 4h of production - Capacity (while operating) 80 barrels/h 100 barrels/h 120 barrels/h Figure 5.10: Data for the production of orange juice
Compute Capacity as function ofbatch size Compute cycletime (CT) of the rest of the process Solve for batchsize: Cap(B)=1/CT Set-up times dominate Analyze Set-up timesand Set-upcosts Compute set-upcosts and inventory costs Use EOQmodel or oneof its variants Set-up costs dominate • Set-up time reduction, SMED • Process lay-out Reduce the need for batches Figure 5.11.: Summary of batching
Responsiveness High Set-up occurs atnon-bottleneck=> use smaller batches Reduce set-up times Set-up occurs At bottleneck=> use larger batches Now Higher frontier Low High perunit costs Low perunit costs Costs Figure 5.12.: Choosing a batch size and reducing set-up costs / time