Online GeoSpatial Processing (OLGP): Enhancements in WebGIS Applications Using UMN-MapServer
320 likes | 426 Vues
This presentation details the development of Online GeoSpatial Processing (OLGP) as an extension to MapServer, addressing the need for efficient delivery of geospatial data via the web. It emphasizes the integration of remote sensing data, spatial analysis, and RDBMS support, demonstrating a client/server architecture for natural resource monitoring. Key issues discussed include design challenges, validation through case studies, and innovative applications such as NDVI analysis. Contributions, related works, and the impact of OLGP on geospatial data accessibility are also highlighted.

Online GeoSpatial Processing (OLGP): Enhancements in WebGIS Applications Using UMN-MapServer
E N D
Presentation Transcript
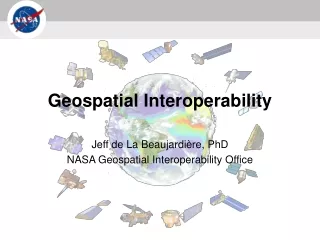
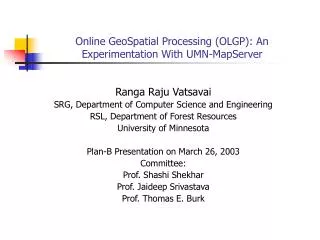
Online GeoSpatial Processing (OLGP): An Experimentation With UMN-MapServer Ranga Raju Vatsavai SRG, Department of Computer Science and Engineering RSL, Department of Forest Resources University of Minnesota Plan-B Presentation on March 26, 2003 Committee: Prof. Shashi Shekhar Prof. Jaideep Srivastava Prof. Thomas E. Burk
Outline • Motivation • Contributions • Relate Work • WebGIS Architectures • Our Approach • Architecture • GeoProcessing • Design Issues • Validation (Case Study) • NRAMS and kNN Applications • Conclusions
Motivation • Proper use and monitoring of environmental resources requires • Timely and accurate data on land use • Regular availability • Remote Sensing and GIS • Invaluable input for natural resource analysis and mapping • Problem? • Lack of an efficient and easy-to-use delivery mechanism. • Internet • Web has became popular as a vehicle for information distribution and client/server applications. • GISes are Standalone • Web offers a convenient way to share complex multimedia data
Motivation • Background Background • ForNet • One of 18 Remote Sensing Database (RSD) programs funded by NASA • MapServer and ImageServer • MapServer • Monolithic CGI program • Map Creation, Simple feature query, Feature annotation, feature classification, on-the-fly projection, etc. • MapScript: Rapid prototyping of web applications with server-side scripting languages. • Beyond WebMapping (OLGP extension to MapServer) • GeoSpatial Analysis and Native DBMS support
Motivation • Contributions Contributions • Beyond Web Mapping • Online GeoSpatial Processing (OLGP) • Efficient Implementation • Load Balancing Client/Server Approach, Fine-tuning • Integration of disparate data sources • Remote Sensing, Sampling Data (FIADB) • Extending Queries • Arbitrary region of interest (ROI) • Integration with RDBMS • Innovative Applications – From theory to practice
Contributions • Related Work WebGIS Architectures • WWW • Intelligent mix of protocols – • Client/Server handshaking and HTTP • HTML and XML • Popularity can be attributed to – • User-friendly Web Clients (Netscape, IE, ..) • Recent Advancements in development environments • WebGIS • Main Components • The Client, The Server and the Network • Limitations – No support for geographic elements • Initial developments – Visualization (MapViewer from Xerox PARC)
Contributions • Related Work Related Work - WebGIS Architectures • Initial Focus – Map Visualization (e.g. MapViewer –Xerox) • First noticeable WebGIS – GRASSLinks (UC, Berkeley) • Industry’s Initial response • CGI Wrappers to their standalone GIS • This resulted in “thin-client/fat-server” systems • Limitations • Server is overburdened with data access and analysis • As the number of requests increases, server performance decreases • Benefits • Users does not need any additional resources • Recent Advances in Internet Development Environments • Applets, ActiveX Controls and Extendible Web Clients (“plug-ins”) • Client-side GIS • Resulted in “thick-client/thin-server” systems
Related Work • Our Approach Architecture
Related Work • Our Approach Architecture • WEBSAS - Architecture • “Balanced Client/Server” paradigm • 3-tier Architecture • Tier 1: Client • Tier 2: Application Server • CGI Module (+MapServer) • GeoSpatial Analysis System • Communication System • Tier 3: GeoSpatial Database Access System • Generic Image support (BIL/BSQ/BIP) • Native RDBMS support (MySQL, Oracle etc).
Related Work • Our Approach GeoSpatial Analysis • Availability of multi-temporal AVHRR imagery made it possible – • Plant phenology • Quantitatively describe NPP patterns in time and space • Monitor and Map natural resources at regional and global scales. • NDVI and NDVI Profiles • A temporal profile is a graphical plot of sequential NDVI observations against time. • These profiles quantify the remotely sensed vegetation’s seasonality and dynamics • ROI and Polygon based queries • Change Detection
Related Work • Our Approach GeoSpatial Analysis – Spatial Interpolation Queries • Given • a set of sample plots (locations) and • a set of corresponding attributes • a set of spatial database layers (RS,..) • user specified arbitrary region of interest (ROI) • Find • Estimates for each location inside the ROI • i.e. Generalize queries over space • Constraints • Non-numerical attributes, auto-correlation • Objective • Minimize error
Related Work • Our Approach GeoSpatial Analysis – Spatial Interpolation Queries Query Window Given FIADB SURVEY(..,statecd,cycle,subcycle,…) #12 COUNTY(..,statecd,unitcd,countycd,..) #6 PLOT(..,statecd,cycle,unitcd,plot,..) #28 SUBPLOT(..,statecd, ..,subp, ..) #13 COND(..,statecd,..,conid,..) #48 TREE(..,statecd,..,tree,..) #61 SEEDLING(..,statecd,..,spcd,..) #12 Find estimates at each cell
Related Work • Our Approach GeoSpatial Analysis – Spatial Interpolation Queries • Extract FIA plot-id and coordinates from FIADB plot-id[], x[], y[] <- SELECT p.plot, p.lat, p.lon FROM Plot p WHERE p.countycd = ‘137’ and … • Coordinate transform :: lattitude/longitude into UTM (meters) ima_x[], img_y[] <- geo_to_utm(p.lat[], p.lon[]) Algorithm
Related Work • Our Approach GeoSpatial Analysis – Spatial Interpolation Queries • For each plot, compute mean of 3x3 window Signature[][] <- mean(p.plot, DN[][]). • For each pixel vector (scan each line, and each pixel in a line) pixel[] <- Dni, where i = 1,2, .., #of channels Algorithm
255 Signature[][] Pixel[] IR 0 Red 255 • Related Work • Our Approach GeoSpatial Analysis – Spatial Interpolation Queries • Compute Euclidean-distance between pixel[] and each spectral signature Distance[plotid[]] <- euc_dist(pixel[], signature[][]) Algorithm
Related Work • Our Approach GeoSpatial Analysis – Spatial Interpolation Queries • Assign the closest FIA plot-id to the output pixel(x,y) Opixel(x,y) <- min(dist[]) • Repeat (for all pixels) Algorithm
Related Work • Our Approach GeoSpatial Analysis – Spatial Interpolation Queries • Generic FIA Query • Calculate the total number of all live white pine trees on timberland in the state of Michigan SELECT SUM(p.expcurr * t.tpacurr) FROM plot p, cond c, tree t WHERE p.statecd = 26 AND (joint conditions ..) • Limitations? • How about estimates for a census bloc?
Related Work • Our Approach GeoSpatial Analysis – Spatial Interpolation Queries • Extract plot-id’s from plot-id image • Generate plot-id histogram ( {<plot-id, frequency>, …}) • Formulate Query (on-the-fly) SELECT p.plot, p.expcurr, t.tpacurr FROM plot p, cond c, tree t WHERE p.statecd = 26 AND (join conditions ..) AND p.plot in (plot-id-list) • Results = SUM (frequency[p.plot] * p.expcurr * t.tpacurr) Solution FCC Image Plotid Image (Integration)
Related Work • Our Approach Design Choices – System Level Performance Issues • Communication – Amount of data to be transferred • Increasing speed of internet connection • Decreasing the amount of data to be transferred • Progressive Vector Transmission – M.J. Egenhofer et. al. • Efficient Spatial Data Transmission in WEBGIS – Z.-K. Wei • Computation – GeoSpatial Analysis Functions • Designing efficient algorithms • Efficient data structures • Our Approach • Load Balancing • Fine Tuning • Partial Materialization • System Configuration - Ease of Use
Related Work • Our Approach Design Choices Client Request Web Server MapServer Hard-coded Mapping Server Configuration LB=>C or S ? Fg Pre-compute Client Global Optimization Presentation Database Global + Local Template Based Static
Related Work • Our Approach • Design Choices Load Balancing Client/Server • Where should fg be computed • Choices – Server, Client, Pre-realization • Our Approach • Based on amount of data to be transmitted over network – “Output(fg) < Input(fg)” • Based on Response Time. • fg On Server If ((tf < tc) && ( dp di ) || (dp << di)) otherwise fg on client In Server case Data to be transmitted = Output(fg) ( di) In Client case Data to be transmitted = Input(fg)
Related Work • Our Approach • Design Choices Fg Level Fine Tuning • Pre-realization • An important criteria we have adopted in the development of geospatial database • Criteria Apply fg first and populate the geospatial database If the operation is computationally intensive && Parameters are fixed (output is same) && Size (output) Size(input) Else apply fg on-the-fly in WEBSAS
Given images BIP BSQ • Related Work • Our Approach • Design Choices Fg Level Fine Tuning • Multi-temporal Image Organization –Band Interleaved by Pixel (BIP).
Related Work • Our Approach • Design Choices Partial Materialization • Partial-materialization • Division of fg into sequence of sub-tasks • If possible pre-compute one of the compute-intensive subtask • Example – kNN in queries involving interpolation Query Response Time No materialization Partial materialization NM – 484 MB (St. Louis) PM – 48 MB FM – 96 MB/attribute NM – >10 H PM – (25W-15s, 365W-4m) FM – (25W-1s, 365W-1m) Full materialization Storage Cost
Related Work • Our Approach • Design Choices System Configuration • Application is configured using server-side configuration files • Map Object • Label Object • Layer Object • Feature Object • Web Object • Process Object • Front-end • Standard HTML elements • Java-Script
Related Work • Our Approach • Design Choices System Configuration • Map Object • MAP NAME Application’s Name STATUS On/Off IMAGECOLOR R G B UNITS Meters/Feet FONTSET Fonts file name MARKERSET Filename (Shade/Line) SIZE X Y Layers Scale ….. • END • Layer Object • Layer NAME Layer Name GROUP Name DATA File Name STATUS ON/OFF TYPE Annotation|Point|Line|… MINSCALE N CLASSITEM Column CLASS … LABELITEM Column • END
Our Approach • Validation Validation • Case Studies • Natural Resource Analysis and Mapping System (NRAMS) – A WebGIS application for Land Managers. • Efficient Interpolation Queries (kNN Application) • AVHRR/MODIS Download Facility • Application is on Web Since March 1999. • Usage Statistics • Public Domain Software • Mailing Lists • Over 600 users
NRAMS-Frontend • Analysis • Numerical Window • Histogram Plot • Spectral Plot • Save Image • Window Size • Mapping • Browse Map • Query • Data Layers
Our Approach • Validation NRAMS – Numerical Window and Histograms
Our Approach • Validation NRAMS – Spectral Profiles
Validation • Conclusions Conclusions • Visualization, Query and Beyond • Online GeoSpatial Analysis (OLGP) • Various Design Choices To Improve Performance • Load balancing Client/Server Architecture • Fine tuning, Pre/Partial materialization • Template Based System Configuration • Open Source, Documentation, Mailing Lists, Trusted User Base, Dynamic, Innovative applications • 600 users, 10 developers, universities, public, private • Avg. 10,000 Data products/month • Future Directions • Caching – Both server side and client side • Persistent database connections • Web Coverage Standard
Acknowledgements http://terrasip.gis.umn.edu/projects/ NASA Funding Prof. Shekhar, Prof. Tom Burk, Prof. Jaideep, Steve Lime (DNR), Perry, Jamie, Mark Hansen, SRG members, RSL members.