
Statistic Recap
E N D
Presentation Transcript
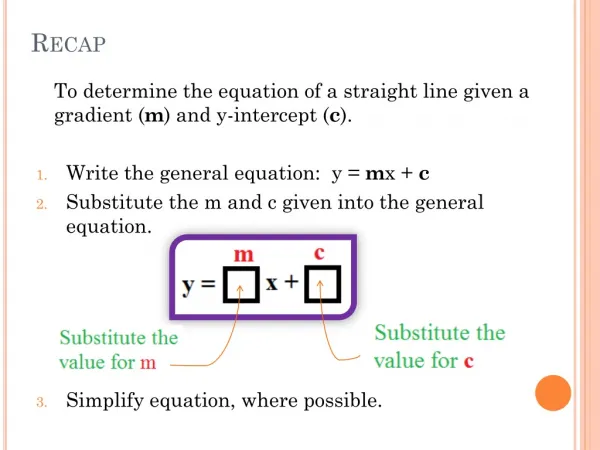
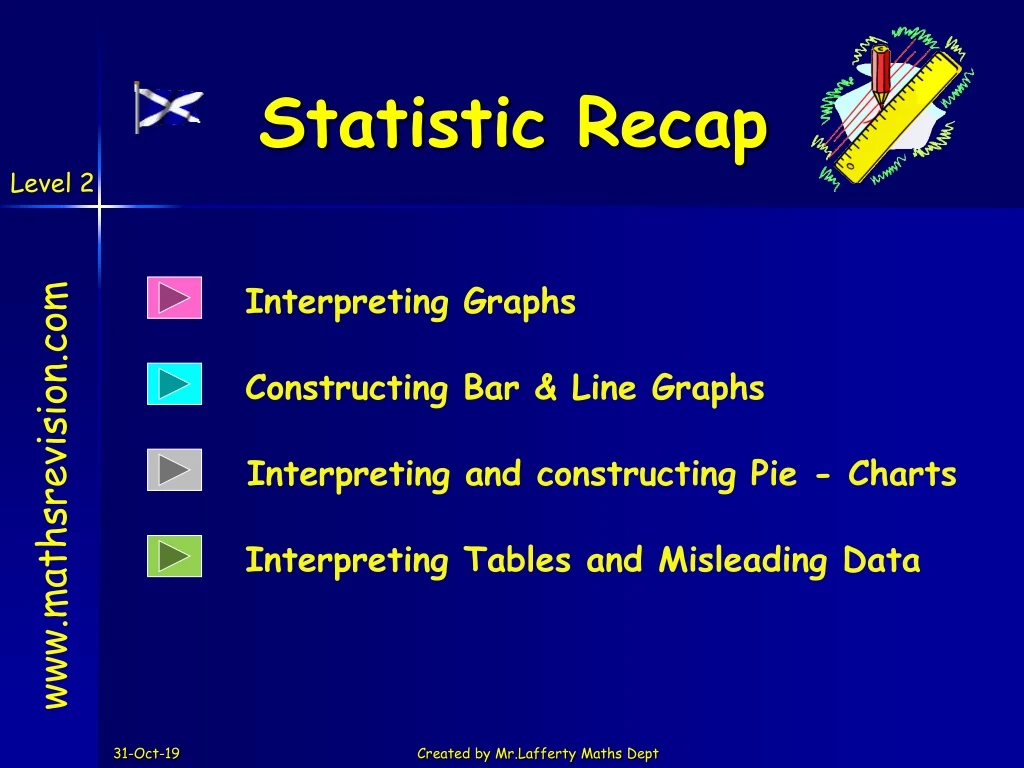
Statistic Recap Interpreting Graphs Constructing Bar & Line Graphs Interpreting and constructing Pie - Charts www.mathsrevision.com Interpreting Tables and Misleading Data Created by Mr.Lafferty Maths Dept
Starter Questions www.mathsrevision.com Created by Mr.Lafferty Maths Dept
Graphs Learning Intention Success Criteria • We are learning to interpret Graphs & Tables. • 1. Be able to read information from a Graph or Table. 2. Answer questions related to the Graph or Table. www.mathsrevision.com Created by Mr.Lafferty Maths Dept
What does 1 computer represent You have 1 minute to come up with a question Interpreting Graphs www.mathsrevision.com
What does 1 snowflake represent You have 1 minute to come up with a question Interpreting Graphs www.mathsrevision.com
Bar Graphs www.mathsrevision.com Created by Mr.Lafferty Maths Dept
Bar Graphs www.mathsrevision.com Created by Mr.Lafferty Maths Dept
Line Graphs www.mathsrevision.com Created by Mr.Lafferty Maths Dept
Line Graphs www.mathsrevision.com Created by Mr.Lafferty Maths Dept
Interpreting Graph Now try TJ2b Q1 , Q2 , Q5 , Q6 Ch 17 (Page 156) www.mathsrevision.com Created by Mr.Lafferty Maths Dept
Bar Graphs A survey of S1 pupils asked what their favourite pet was. The results are shown below www.mathsrevision.com Lets construct a Bar graph for the following table Remember graph has to be labelled and neat ! Created by Mr.Lafferty Maths Dept
What labels should we use for the Bar Chart Title, Scale, Labels and Units where appropriate Favourite Pets 12 10 8 Number of Pupils 6 4 2 0 Cat Dog Rabbit Hamster Snake Pets
Line Graphs Lets construct a line graph for the following table www.mathsrevision.com Remember graph has to be labelled and neat ! Created by Mr.Lafferty Maths Dept
12 10 8 Number of Flies 6 4 2 0 Mon Tue Wed Thur Fri Days
Constructing Graphs Now try TJ2b Q3 , Q4 and Q7 Ch 17 (Page 156) www.mathsrevision.com Created by Mr.Lafferty Maths Dept
Starter Questions www.mathsrevision.com Created by Mr.Lafferty Maths Dept
Pie Charts Learning Intention Success Criteria • We are learning to interpret and construct a Pie Charts. • 1. Be able to read information from a Pie Chart. 2. Be able answer questions based on the Pie Chart. www.mathsrevision.com 2. Construct basic Pie Charts. Created by Mr.Lafferty Maths Dept
Pie Charts 50 people were asked what was there favourite holiday Spain How many chose America www.mathsrevision.com Created by Mr.Lafferty Maths Dept
Easy Pie Charts A survey was conducted to find peoples favourite food. The percentage results are given below. Construct a Pie Chart to represent the data. What is your favourite food ? www.mathsrevision.com Created by Mr. Lafferty
Work out the percentage of each slice. Favourite Food www.mathsrevision.com Created by Mr. Lafferty
Favourite Food www.mathsrevision.com Created by Mr. Lafferty
Pie Charts Now try TJ2b Q8 , Q9 and Q10 Ch 17 (Page 158) www.mathsrevision.com Created by Mr.Lafferty Maths Dept
Starter Questions Q1. Q2. How long between 8:12am to 2.09pm Q3. 75.9 x 7 www.mathsrevision.com Find arrow value Q4. 1300 1200 Q5. The answer to a question is 81. Write down the question. Created by Mr. Lafferty
Table and Misleading Data Learning Intention Success Criteria 1. Understand the important giving accurate information. • We are learning to interpret tables and how some data presentations can be misleading. 2. Be able to recognise misleading information and interpret information in a table. www.mathsrevision.com Created by Mr. Lafferty Maths Dept.
Paul is always looking for the best deal. He uses 5 minutes per day on calls, 11 texts per day and lots of online searches. What tariff is best ? Tom uses very little calls or internet but sends 10 texts a day. What tariff is best ? Caitlin loves to be online, calls her friend 10 minutes per day and sends 80 texts a day. What tariff is best ? Best Deal Rates & Contracts Below is a typical set of contracts for a mobile phone www.mathsrevision.com Created by Mr.Lafferty Maths Dept
Vertical scale should start at 0. Misleading Data Created by Mr. Lafferty
Misleading Data Whole circle should add up to 100% Created by Mr. Lafferty
No Scale and 3D gives false impression. Misleading Data 1995 and 1997 sold the same number of records
Misleading Data Now try TJ2b Q11 , Q12 and Q13 Ch 17 (Page 159) www.mathsrevision.com Created by Mr.Lafferty Maths Dept