Wind Measurements
Explore the various classes of wind sensors, such as anemometers and thermal anemometers, along with their mechanisms and applications for measuring wind speed and direction. Learn about dynamic force anemometers, windmill anemometers, and laser Doppler anemometers.

Wind Measurements
E N D
Presentation Transcript
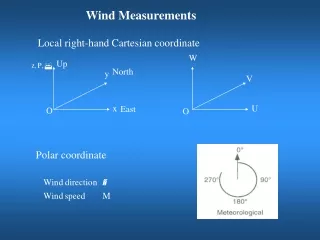
Wind Measurements Local right-hand Cartesian coordinate W Up North y V x U East O O Polar coordinate
Conversion to speed and direction Conversion to U and V
Unites of wind speeds m/s, mile/h, km/h, knot, … Wind sensors There are three classes of instruments: 1. dynamic force anemometers 2. pressure pulse frequency anemometers 3. thermal anemometers Dynamic force anemometers cup anemometers, vane windmill, and gill-type anemometers Drives an electrical generator Threshold
Cup anemometer Vane windmill Gill-type anemometer
Four Cup anemometer It was invented (1846) by Dr. John Thomas Romney Robinson But he wrongly claimed that no matter how big the cups or how long the arms, the cups always move with one-third of the speed of the wind. Anemometer factor : the actual relationship between the speed of the wind and that of the cups. It depends on the dimensions of the cups and arms
Three Cup anemometer Three cup anemometer was developed by the Canadian John Patterson in 1926 Patterson found that each cup produced maximum torque when it was at 45 degrees to the wind flow. The three cup anemometer also has a more constant torque and responds more quickly to gusts than the four cup anemometer Wind direction: 1. Australian Derek Weston added a tag to one cup, which causes the cupwheel speed to increase and decrease as the tag moves alternately with and against the wind. Wind direction, then, can be calculated from these cyclical changes in cupwheel speed, while wind speed is as usual determined from the average cupwheel speed. 2. Add a separate of wind vane for directional readings.
Windmill anemometers For windmill, the axis of rotation must be parallel to the direction of the wind and therefore horizontal. Furthermore, since the wind varies in direction and the axis has to follow its changes, a wind vane or some other contrivance to fulfill the same purpose must be employed. The R.M. Young Wind Monitor It combines a propeller and a tail on the same axis to obtain accurate and precise wind speed and direction.
Gill Propeller Anemometer Gill Propeller Anemometer utilizes a fast response helicoid propeller whose rotation is linearly proportional to air velocity. However, the propeller responds only to the component of the air flow which is parallel to its axis of rotation. For perpendicular air flow, the propeller does not rotate.Thus, using three parallels, one can measure 3-D winds. The standard expanded polystyrene (EPS) propeller offers maximum sensitivity at low wind speeds. Propeller response as a function of winds approximates the cosine curve, allowing true wind velocity and direction to be calculated. The propeller anemometer is especially suited for measuring the vertical wind component.
Pressure pulse frequency anemometers (sonic anemometer ) It measures the variation of speed of sound with wind The best way to get the wind direction is to measure the components in all three directions
2-D sonic anemometer 3-D sonic anemometer The spatial resolution is given by the path length between transducers, which is typically 10 to 20 cm Sonic anemometers can take measurements with very fine temporal resolution, 20 Hz or better, which make them well suited for turbulence measurements. Their main disadvantage is the distortion of the flow itself by the structure supporting the transducers, which requires a correction based upon wind tunnel measurements to minimize the effect.
The transducers are usually made by piezoelectric crystals and completely sealed for rugged outdoor operation. The electronics are all contained within the probe bar. This allows it to be operated as a tower mounted instrument, capable of withstanding hostile environmental conditions. The transducer operation and sonic functions, as well as all computation and transmission of data, are under microprocessor control. Most sonic anemometer can also measure temperature
Thermal anemometers (hot wire anemometers ) It uses a very fine wire (on the order of several micrometers) electrically heated up to some temperature above the ambient. Air flowing past the wire has a cooling effect on the wire. As the electrical resistance of most metals is dependent upon the temperature of the metal (tungsten is a popular choice for hot-wires), a relationship can be obtained between the resistance of the wire and the flow velocity. CCA (Constant-Current Anemometer) CVA (Constant-Voltage Anemometer) CTA (Constant-Temperature Anemometer)
Velocity pressure probe Five-hole pressure probe
Laser Doppler anemometers Laser Doppler anemometers use a beam of light from a laser. Particulates flowing along with air molecules near where the beam exits reflect, or backscatter, the light back into a detector, where it is measured relative to the original laser beam. When the particles are in great motion, they produce a Doppler shift for measuring wind speed in the laser light, which is used to calculate the speed of the particles, and therefore the air around the anemometer.
Wind profilers • A wind profiler is a type of sensitive Doppler radar that uses electromagnetic waves or sound waves to detect the wind speed and direction at various elevations above the ground, up to the troposphere (i.e., between 8 and 17 km above mean sea level) • Detection of the signal backscattered from refractive index in-homogeneities in the atmosphere • In clear air the scattering targets are the temperature and humidity fluctuations produced by turbulent eddies
Scattering Mechanism • Scattering from atmospheric targets: • irregularities in the refractive index of the air • hydrometeors, particularly wet ones (rain, melting snow, water coated ice) • Scattering from Non-atmospheric targets: • birds and insects (frequency dependant) • smoke plumes • Interfering signals: • Ground and sea clutter • Aircraft and migrating birds • RFI (depends on frequency band) RFI: Radio Frequency Interference is generated from spikes/surges that usually come from - Lightning, man-made electrical equipment noise and various transmitting equipment.
Scattering Mechanism When a pulse encounters a target... It is scattered in all directions. Of interest is the signal component received back at the radar. This signal is typically much weaker than the original sent from the transmitter and is called the "return signal". The larger the target, the stronger the scattered signal.
Doppler Shift • Doppler Formula: • fd = - 2 *Vr / • DopplerMeasurement of wind speed based on the Doppler shift in the received signal: • where Vr is the radial velocity of the scatterers • is wave length • Examples of Wind Profiler Doppler shift (radial velocity 10m/s) • 50MHz, wavelength 6m, Doppler shift 3.34Hz • 449MHz, wavelength 0.66815m, Doppler shift 29.9Hz • 1290MHz, wavelength 0.23m, Doppler shift 86Hz
Typical frequencies used in wind profiling 45-65 MHz 404-482 MHz 915-924 MHz 1280-1357.5 MHz The 915 MHz (33 cm, UHF) profiler measures the wind at low levels, typically up to 1-3 km above ground level, depending on atmospheric conditions, especially humidity. The top of the atmospheric boundary layer marked by the entrainment zone is very visible because the large humidity and temperature gradient there cause a large change in index of refraction. The 915 MHz profiler has fairly small antennas (at most 2x2 or 3x3 m), making it transportable and less expensive.
A VHF wind profiler (50 MHz or 6 m) measures wind profiles between 2 and 16, occasionally 20 km above the ground level (AGL), but the antenna occupies 2 soccer fields (100x100m). The US NOAA operates a network of 400 MHz wind profilers. These are smaller (antenna size about 10 x10 m). The higher the frequency, the smaller the antenna, the smaller the turbulent flow scale that is resolved. Frequency 50 MHz 405 MHz 915 MHz Wavelength 600 cm 74 cm 33 cm Antenna 100 m 13 m 2 m
Challenges … • Identificationof Atmospheric Targets but not the Clear Air echoes • Precipitation echoes • Identification Interference Signal • Identification of Clutter • Identification of Non-Atmospheric Targets • Birds, Planes, non-stationary objects from near by buildings , roads (from Radar Side lobes)
NWS NOAA Profiler Network Profiler Equipment Shelter Typical NPN Profiler Site Equipped With RASS 404 MHz Coaxial-Colinear Antenna 449 MHz Coaxial-Colinear Antenna
The vertical velocity of the atmosphere is directly measured by the vertical beam. Wind Profilers detect minute fluctuations in atmospheric density, caused by the turbulent mixing of volumes of air with slightly different temperature and moisture content.
The signal power is a measure of the amount of backscattered power received from the atmosphere. High signal power values (greater than 60 dBZ) are typically associated with high moisture content or the presence of precipitation particles, while low power values (less than 40 dBZ) usually indicate a dry or stable atmosphere. Meteorological features such as moisture advection and cloud layers, vertical extent of convection, and bright bands (inferring the 0 degree C level) are all visible at times in the signal power displays.
RASS (Radio Acoustic Sounding System) A profiler site equipped with the RASS option has the capability to measure and produce vertical temperature profiles. The speed of sound is affected by the temperature of the atmosphere. Sound travels through the atmosphere at slightly different speeds at different temperatures. RASS uses this principal to track the speed of the acoustic energy emitted from the RASS Transducers as the sound waves propagate up through the atmosphere. The temperatures of the atmosphere at specific heights are extrapolated from the speed of the RASS wave propagation.