
Conducting Epidemiologic Research: Importance and Study Designs
E N D
Presentation Transcript
OBSERVATIONAL STUDIES-1 BY Dr. Bashir Ssuna MBCh.B, MSc Makerere Epidemiology and Statistical Center info@makepistat.org
Why conduct research? • Measurement of the occurrence of events over time is a fundamental objective of epidemiologic research • How many people are (becoming) diseased? • Regardless of the study design, the ultimate interest is in the disease or outcome-causing properties of factors that are antecedent to the disease or outcome • Why are some diseased? (etiology and causal effects)
Why conduct research? Also, researchers want to gain a better understanding of: • Diagnostics- How can we tell whether someone is has disease? • Intervention - What can we do for the people with disease? • Prognosis – If an individual has disease, what is their chance of survival, the propbability of experienceing complications? • Patient experiences - How does it feel to have the disease?
A good research question A good research question should be Feasible, Interesting, Novel(original), Ethical & Relevant. Assessing the five attributes of a good research question: Feasible • Is the sample size required achievable in a reasonable period of time? • What is the necessary time commitment? Will the investigator devote sufficient time per the time demands for the study? • Does the investigator have the skills and knowledge to plan and carry out the project? Is there need for collaboration? • Is the project too ambitious?
Assessing the five attributes of a good research question: • Interesting • The research question should be interesting not only to the investigator but also to others (clinicians, researchers, etc) in the field. • Novel • Will the research provide new knowledge, or improve our current understanding? • Ethical • Are there any risks to the subjects? Are there any procedures, drugs that may be harmful to the study participants? • Relevant • Is the research question clinically important; is it a question of public health significance? • Eg does the intervention reduce morbidity for patients/improve their quality of life
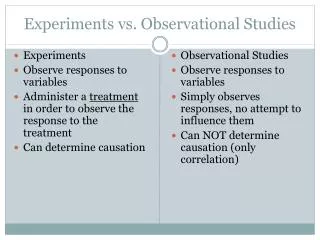
Study Designs • Study designs differ in how individuals are enrolled, the role of time in the study, and the disease risk measures • Epidemiologic study designs can be largely classified into Observational and Experimental designs
Basic Observational Study Designs • Cohort Studies: Ascertain exposure status first, then follow over time to determine outcome status • Case-Control Studies: Ascertain outcome status first, then determine exposure -Cross-Sectional Studies: Ascertain exposure status and outcome status simultaneously • Ecologic / correlational studies- Units of observation are geographically defined populations eg countries or regions within a country. Mean values of the outcome and risk factor for each observation unit are obtained and compared. • Case series • Case reports
Caseseries • A series of patients with a disease is accumulated over time • Each time a case is identified, characteristics of the patient are recorded including, medical history, demographics, lifestyle habits, etc (cross-sectional measurement of exposures in people with disease) • Cases series are used to describe the characteristics of the disease • They do not analyze differences between patients and health individuals (all persons in a Case Series are patients). • Within the sample of patients, there may be important associations.
Example of Case Series • Case series of HIV/AIDS patients • 727 out of 1000 were homosexual or bisexual males • 236/1000 were injecting drug users • Important associations: Higher risk of Kaposi’s Sarcoma among AIDS patients who were homosexual than among those who were injecting drug users
Cohort Studies • Cohort - individuals sharing a common characteristic and observed over time in the group • Cohort studies also referred to as Follow up studies; Longitudinal studies • Can be used to study exposures that are thought to decrease or increase risk of the outcome(s) under study
Cohort studies • A group of individuals is followed over time • Exposure to one or more factors that is thought to influence disease occurrence is recorded • Incidence of one or more outcomes is recorded • Exposure is not manipulated by the investigator • Cohorts are classified as • Concurrent or prospective cohort • Retrospective or historical cohort • Prospective cohort design is a powerful strategy for investigating the causes or etiology of disease
Prospective cohort studies THE FUTURE THE PRESENT Time Population without disease No disease Disease EXPOSED Disease No disease NOT EXPOSED Sample Individuals without disease are selected for observation over time
Example of Cohort Studies British Doctors Study (PI-Bradford Hill) • 1951 Data for this study were obtained from physicians listed in the British Medical Register who resided in England and Wales as of October 1951 Questionnaires about smoking habits sent to all registered physicians; complete replies returned from 6,194 women and 34,439 men. Follow-up in 1957, 1966, 1972, 1978, and 1990
British Doctors Study • Follow-up Procedures, 1951-1991 • Periodic mail questionnaires to the doctors • Monitoring of deaths via the Office of Population Censuses and Surveys; obituary columns of the British Medical Journal and the Medical Directory • Correspondence with people living at the doctors’ last known addresses and with people who knew them
Selection of the cohort population Prospective cohort • The study population may be selected basing on whether they are Exposed or Not OR • Select the cohort population before their exposure status is identified. Cohort participants are selected based on other factors unrelated to exposure such as place of residence. Take a history or blood tests to identify those who are exposed and those who are not exposed. OR • Select the cohort population before any exposure has occurred (exposure of interest may not take place along time after the study population has been defined).
Selection of the cohort population • If the exposure is common e.g. smoking, contraceptives, and the disease outcome is fairly common, a “population-based cohort” is appropriate e.g. the Framingham study cohort. • Framingham study designed to test hypotheses about etiology of CHD. Study began in 1948. Eligibility:-being a resident of Framingham town, aged 30-62 years. Risk factors investigated include age, hypertension, cholesterol, tobacco and alcohol use, body weight, diabetes mellitus, physical activity. Visit the website at http://www.framinghamheartstudy.org/ • For rare exposures, “exposure-based cohorts” are more desirable e.g. occupational groups, such as nuclear power plant workers, miners, ginnery workers
Selection of the unexposed population (comparison group) • Should be as similar as possible to exposed group, except for the exposure(s) of interest • May be: • Internal (i.e., unexposed or less exposed members of the cohort)—Most common method with prospective cohorts • External (i.e., outside of the exposed cohort) • Another cohort (e.g., from another industry) • General public
Representativeness of cohorts Cohorts may be selected to be representative of: • The general population (e.g. Framingham study) • Residents of a geographically defined area (e.g. San Francisco Men’s Health study) • A professional group (e.g. Nurses’ Health study, British Physicians’ study) • A highly exposed group (e.g. workers in factories)
Types of cohorts A cohort may be closed (fixed cohort) or it may be dynamic(open-cohort) A closed cohort has fixed membership. • Once the cohort is defined and follow-up begins, no one can be added. • Becomes smaller with passing time. A dynamic cohort can take on new members as time passes. • Size of population may decrease or increase with time.
Cohort studies - Outcomes • Unrepeatable vs Repeatable • Unrepeatable -e.g. first heart attack, lung cancer, death • Repeatable e.g. episodes of diarrhea, respiratory infection, asthma, malaria • Long vs Short latency/induction period • Long latency e.g. cancer following exposure to radiation or asbestos • Short latency e.g. bacterial meningitis
Follow-up of study participants • All individuals in the cohort should be followed-up for the entire duration of the study to maximize person-time contribution, and obtain complete outcome information • Usually there is one outcome of primary interest (eg death or development of a specific disease), but several outcomes may be observed. • Events/outcomes are recorded when they occur during follow-up
Follow-up of study participants • The longer the follow-up, the higher the likelihood of losses to follow-up • High rate of loss to follow-up will reduce study validity • Multiple methods may be needed to track cohort members over the duration of study
Strengths of prospective cohort studies • Possible to get very high quality exposure and outcome data compared to most other observational study types • Exposure status determined before onset of disease (i.e., no question of which came first) • Can study many disease outcomes at the same time • Less prone to bias than other observational study designs
Limitations of prospective cohort studies • Very expensive! • Can take a long time to get useful results • Not efficient for studying rare diseases or diseases with long latency (e.g., cancers).
Retrospective cohort studies • Sometimes called “historical cohort studies” • Define a previously existing group (e.g., workers in a particular industry) and trace their mortality or disease incidence to the present (or close to the present). • Compare outcomes in exposed and unexposed subjects • All exposures and disease or mortality events have already taken place by the time the study begins.
Retrospective cohort studies Investigator needs information on this population Investigator begins study here
Retrospective cohort studies require: • Means of comprehensively identifying the cohort population in the past • A suitable comparison group • Means of tracking “vital status” of the exposed and unexposed populations from start to end of the follow-up period • Ways to track disease/mortality experience in the two groups over the follow-up period • Measures of exposure for cohort members
Strengths of retrospective cohort studies • Much quicker and cheaper than prospective cohort studies • Can study multiple causes of death/disease • Useful for rare exposures (e.g., occupational exposures) • Good for investigating long latency diseases • Can study effects of exposures that no longer occur (e.g., discontinued medical treatments.)
Limitations of retrospective cohort studies • May be difficult to comprehensively define cohorts that previously existed • Exposure data (including confounders) not as good as for prospective cohorts • Cohort members are not contacted, as some of them are already dead or lost to follow-up at beginning of study • Loss to follow-up is usually greater than in prospective studies • Less efficient for rare diseases than case-control studies • Mainly useful for death or cancer incidence • Not useful for study of emerging, new exposures
Presentation of Cohort data Exposed Unexposed Disease No Disease Disease No Disease (a) (b) (c) (d) Presentation of data in a two-by-two table from a cohort study (i)
Presentation of data from a cohort study (ii) -when person-time is known
Analysis of cohort data • Measures of disease frequency • Cumulative incidence(risk) • Among the exposed Ie= a/(a+b) • Among the unexposed Iu=c/(c+d) • Incidence density (incidence rate) • Among the exposed- IDe=a/PYe • Among the unexposed IDu= c/PYu
Analysis of cohort data Measures of effect • Risk difference = Ie- Iu, • Rate difference = IDe - IDu • Risk ratio = Ie Iu • Rate ratio = IDe IDu
Analysis of cohort data Measures of effect • Odds ratios OR=ad/bc • Attributable (etiologic) Fraction –attributable risk percent • Attributable fraction in the exposed = RR-1 x100 RR or ARexp(%)= (Ie-Iu)/Ie*100 • Attributable fraction in the population (%PAR) pe*(RR-1) wherepe is the prevalence of exposure in the target population * 100 %PAR= pe*(RR-1) +1
Analysis of cohort data - Example Lung Cancer Deaths among British Male Physicians Aged 35 & Over: Mortality, Relative Risk, and Attributable Risk
Lung Cancer Mortality among British Male Physicians Aged 35 & Over
Lung Cancer Deaths among British Male Physicians Aged 35 & Over: Mortality, Relative Risk, and Attributable Risk (continued) Excess Rate: 81-7=74 per 100,000Attributable FractionEX (Attributable Risk %; Etiologic Fraction among the Exposed) AR=(Mortality rate in exposed – mortality rate in unexposed)/mortality rate in exposed IDe - IDu = 81-7 = 74 = 91% IDe 81 81 Also, AR= RR-1 = 11.6-1 = 91% RR 11.6 Interpretation: Among smokers, 91% of lung cancer deaths are “attributable” to smoking and potentially preventable by removing the exposure (i.e. smoking)
Lung Cancer among British Male Physicians ≥ 35 Related to Smoking Habits **Light smokers (1-14gm daily); Moderate smokers (15-24gm daily); Heavy smokers (≥25gm daily) From Doll and Hill, 1956
Relative Risks (Rate Ratios) • Light Smokers: 0.47/0.07 = 6.7 • Moderate Smokers: 0.86/0.07 = 12.3 • Heavy Smokers: 1.66/0.07 = 23.7