Advancements in Satellite Data Usage for Climate Modeling and Prediction at NASA
The NASA Modeling, Analysis, and Prediction (MAP) Program utilizes satellite data to enhance understanding of Earth's climate system. This initiative employs various satellites, such as GRACE and Aqua, to collect essential data on sea surface temperature, precipitation, and more. By integrating advanced data assimilation techniques and comprehensive earth system models, MAP aims to improve predictions of climate variability and change. Key research areas include cloud dynamics, ocean circulation, and atmospheric interactions. The program supports national and international scientific assessments to optimize satellite data for modeling and forecasting.

Advancements in Satellite Data Usage for Climate Modeling and Prediction at NASA
E N D
Presentation Transcript
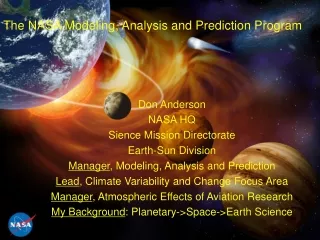
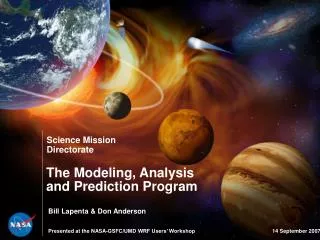
The Modeling, Analysis and Prediction Program Bill Lapenta & Don Anderson Presented at the NASA-GSFC/UMD WRF Users’ Workshop 14 September 2007
Tools - 14 Major Satellites in Orbit GRACE Cloudsat NOAA POES CALIPSO Aqua TRMM Terra EO-1 QuikSCAT Aura Jason Landsat SORCE ICESat
Models used for: • Improved scientific understanding • Hypothesis testing • Prediction NASA Conducts Observation Driven Modeling…. • Satellites provide global sea surface temperature, surface winds, surface height, precipitation and soil moisture • Satellite observations characterize variability at seasonal-to-interannual timescales and provide information to initialize and validate forecasts using coupled models • NASA supports R&A for optimal use of these data for analysis and prediction
The NASA Modeling Analysis and Prediction (MAP) Program • Motivating Requirements: • Models are the theoretical summary of our understanding of how nature works • Each of the Earth Science Focus Areas has prediction as one of its goals. • Predicting climate variability and change requires comprehensive models that include feedback processes involving the atmosphere, land, ocean and sea-ice, between the climate and biogeochemical and hydrological cycles. “Complete models of the Earth system must be developed along with advanced data assimilation techniques that can incorporate all observations into the model to produce consistent 4D data sets for research and operations.” [NRC Decadal Survey (2007)] http://map.nasa.gov/index.html
MAP Goals, Systems and Tools • Program goals: • Create data assimilation capabilities for available diverse data types • Develop computational modeling capabilities for research focus areas • Bring satellite data to bear on model development • Contribute to development of the observing system • Participate in national and international scientific assessments • The ‘system’ includes: • Infrastructure to support system development (ESMF) • Visualization • Integration • Testing • Evaluation • Program Supports: • Coupled model advances • Data assimilation • Reanalysis • Observing System Simulation Experiment (OSSE) tools • Computer/information systems GEOS-5 http://map.nasa.gov/index.html
Cloud Modeling and Analysis Initiative (CMAI) NASA satellite observations provide invaluable information to address deficiencies in climate and weather models. The A-train provides an unprecedented opportunity for the observation and study of cloud properties and behavior. • Science Questions: • Cloud formation processes: what is the mass flow rate of vapor-to-condensate for liquid clouds and for ice clouds? • Precipitation formation processes: what is the mass flow rate of cloud condensate to precipitation form, both rain and snow? • Cloud lifecycle dynamics: what is the scale dependence of the coupling of atmospheric dynamics with radiation and precipitation by clouds? • Orographic effects: what are the effects of orography on cloud-precipitation behavior? • How does the presence of a changing aerosol environment influence cloud and precipitation behavior? • Motivating Requirements: • Representation of clouds and cloud processes in climate and weather models is one of the central issues driving uncertainty in forecasts • Status and Path Forward: • CMAI workshops/meetings held, 20-21 April 2006; MAP ST meeting 7-9 March 2007. • Three study themes: • The Pacific Cross-Section (PAC) study: What determines the variability of clouds and convection and what determines the transitions in convective style over the cross-section? • The Cyclone Lifecycle (CYC) study: What controls the locations of cyclogenesis and cyclolysis and how do cloud processes affect the evolution of these storms? • The Arctic Clouds (ARC) study: What role do aerosols and phase changes in Arctic clouds play in the formation and evolution of Arctic cloudiness and their effect on the atmospheric moisture budget? • Model participants: • GEOS-5, Model-E, MMF, WRF
Estimating the Circulation and Climate of the Ocean ECCO • ECCO seeks the best possible estimate of the time-evolving ocean circulation, its influence on climate, chemistry, biology, etc. • understanding of predictability and determination of what we do not understand. A two+ generation problem! • Observations of mesoscale and sub-mesoscale ocean variability are a key requirement for understanding regional and global climate processes • ECCO2 provides a framework for utilizing high-resolution data from existing and future NASA satellite missions. Estimated sea level trend, spatial mean removed (Wunsch, Ponte, and Heimbach, 2007). Ground tracks of TOPEX/Jason tandem mission superimposed on satellite imagery of sea surface temperature.
The MAP Global Modeling Initiative (GMI) Goal: to develop and maintain a state-of-the-art modular 3-D chemistry and transport model that can be used for assessment of the impact of various natural and anthropogenic perturbations on atmospheric composition and chemistry • Integrated a chemical-transport model spanning the surface to the mesopause includes full tropospheric and stratospheric chemistry • GMI algorithms are contributed by different community members, and represent the state of the art in terms of meteorological fields, chemistry, and deposition processes. • Simulations of the Upper Troposphere/Lower Stratosphere region particularly important region for climate simulations. • By incorporating different algorithms into the GMI, the model can test them in comparison to satellite data • These algorithms can then be included with confidence in fully coupled chemistry-climate model. http://gmi.gsfc.nasa.gov/gmi.html
Short-term Climate Prediction NASA satellite observations characterize variability at seasonal-to-interannual timescales and provide information to initialize and validate forecasts using coupled models. Satellites are the sole source of Global sea surface temperature, surface winds, surface height, precipitation and soil moisture. • Science Questions: • What is the predictability of subseasonal to interannual climate forecast skill at all scales - global to regional - MJO, El Niño and other? • What controls predictability, i.e., what has to be observed? • How do we realize the theoretical predictability estimated from perfect model simulations? • What is the impact of global change on seasonal forecast skill? On extreme weather events? • Motivating Requirements: • El Niño impacts economies worldwide ; yet impacts of such climate anomalies are regional e.g., extreme events (severe storms, prolonged drought) • Seasonal-to-interannual forecasts - the touchstone and validation for long-term climate prediction (decadal and longer) - improves models by forced confrontation between models and data • Status: • GMAO’s coupled model forecasts are contributed to national consensus forecasts; • Advanced ocean data assimilation (GMAO, ECCO); advanced land data assimilation (GMAO) • GMAO’s altimetry assimilation and initialization of soil moisture improve forecast skill, but major breakthroughs are required for further advances; national pathway is multi-model ensemble prediction • Demonstrated ability to simulate major features in 20th century climate variations - e.g., Great Plains dustbowl, seasonality of precipitation and temperature trends over US. GMAO monthly rainfall forecast skill level (r2 versus observations) using soil moisture data not using soil moisture data
Climate Change Model and Climate Sensitivity to Forcings:Both the Forcing and the Feedbacks still have great uncertainties Future emphasis will be on an observing system that allows us to monitor trends in both forcings and feedbacks • Science Questions: • How is the Earth’s climate changing? • What are the primary forcings of the Earth’s climate? • How does climate respond to natural and human forcings? • What are the consequences of climate change for civilization? • How well can we predict future climate changes? • Motivating Requirements: • To assess appropriate mitigation/adaptation actions, we must know the climate sensitivity: hence the climate forcings and system response • For future projections, only models are available: so the models must have the proper sensitivity • Status: • GISS coupled model (using ModelE AGCM) contributed to IPCC AR4 climate projections • AR4: Cloud feedback remains the largest uncertainty in climate sensitivity and low clouds dominate the uncertainty. • AR4: Aerosol indirect effect remains the largest uncertainty in anthropogenic radiative forcing • AR4: Large uncertainty in projection of Atlantic MOC • A-train on orbit • A-train data depot to visualize and explore co-registered CALIPSO, CloudSat, CERES, MODIS, AIRS, MLS, etc under development • Global energy budget and uncertainty estimates show that ocean temperature estimates are the largest source of uncertainty. • ASIC3 multi-agency workshop on ways to achieve satellite instrument calibration for climate change held May 2006. ERBS: ERBE/SAGE II CERES/SAGE III Monitoring of Radiation Budget, Aerosols Ozone Water Vapor ------------------------ For over 20 years!
Linking Weather and Climate • Problems of “weather” and “climate” typically treated separately • Real physical system is a continuum: • Fast “weather” processes influencing climate variations and change • Slower “climate” fluctuations and change affecting weather • Understanding connections between weather and climate is required to make progress in addressing important societal issues: • Assessing risks of future hurricane activity • The possibility of abrupt climate change • Community must consider taking a more unified view of phenomena and processes across time and spatial scales • Related sub-questions in addressing this broad problem: • 1. How do climate variations and change affect weather phenomena? • 2. How do weather phenomena affect climate variations and change? • 3. What are key phenomena and processes that bridge the time scales between synoptic-scale weather (time scales of order a few days) and climate variations of a season or longer?
Where Does Region Modeling Fit Within the Program? • Must be applied to science questions • Applied to the “Weather” scale issues • Used to conduct process studies • Satellite data assimilation • A tool for NASA field campaign support • Vehicle for transition of research to operations • Longer time scales through Regional Climate
NASA Earth System Modeling in Support of NAMMA The 2006 NASA Modeling and Analysis Program (MAP’06) • NASA GEOS-5 at ¼ degree resolution demonstrates skill in simulating AEW’s and tropical depressions during NAMMA • Provided value-added product to NAMMA Forecast Team • Joint GSFC-MSFC project X Simulated Center X Observed Center Heaviest Precipitation NW of Circulation Center
NASA Earth System Modeling in Support of NASA Field Campaigns Driving WRF with GEOS-5 Analyses and LBC NAMMA TC-4 WMS Viewer