
Uploaded by
walden
1 SLIDES
156 VUES
10LIKES
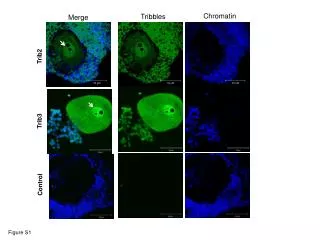
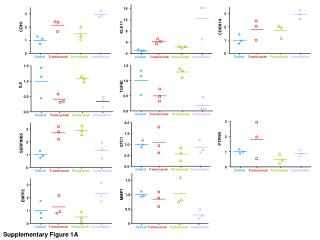
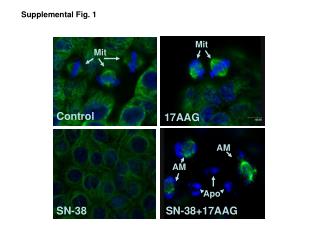
Analysis of Chromatin Dynamics in Tribbles-Expressing Cells Using Hoechst and Alexa488
DESCRIPTION
This figure (Figure S1) presents a series of images illustrating the merge of chromatin staining with Hoechst and fluorescent labeling with Alexa488 in control cells and those expressing Tribbles (Trib2 and Trib3) at a concentration of 50 µM. The visual representation highlights the differences in chromatin organization and distribution influenced by Tribbles, contributing to the understanding of their role in cellular processes. The results are crucial for further investigations into their molecular mechanisms and functions.
Download
1 / 1
Download Presentation

Télécharger la présentation
Analysis of Chromatin Dynamics in Tribbles-Expressing Cells Using Hoechst and Alexa488
An Image/Link below is provided (as is) to download presentation
Download Policy: Content on the Website is provided to you AS IS for your information and personal use and may not be sold / licensed / shared on other websites without getting consent from its author.
Content is provided to you AS IS for your information and personal use only.
Download presentation by click this link.
While downloading, if for some reason you are not able to download a presentation, the publisher may have deleted the file from their server.
During download, if you can't get a presentation, the file might be deleted by the publisher.
E N D
Presentation Transcript
Chromatin Tribbles Merge Alexa488 Hoechst Merge Trib2 Trib3 50 µM 50 µM 50 µM Control Figure S1

More Related
Audio
Live Player