Download
1 / 58
590 likes | 754 Vues
Global Burden of Diseases, Injuries and Risk Factors: methodological aspects and trends. 1 st International Conference on the Burden of Diseases Studies in Brazil November 18 th , 2009 Rafael Lozano, MD. MSc. Outline. What is “GBD” GBD in the last 20 years

E N D
Global Burden of Diseases, Injuries and Risk Factors: methodological aspects and trends 1st International Conference on the Burden of Diseases Studies in Brazil November 18th, 2009 Rafael Lozano, MD. MSc.
Outline • What is “GBD” • GBD in the last 20 years • GBD 2005 is not only an update of the reference year • Where is GBD making contributions to global health
Burden of Disease “…the gap between a population’s health status and some reference standard…” Murray 1996 7
Outline • What is “GBD” • GBD in the last 20 years • GBD 2005 is not only an update • Where is GBD making contributions to global health
Brief History • In May of 1993, a group of Mexicans went to Boston to learn the methods of the BOD • Dr Chris Murray was contracted as advisor of the study “The Health and the Economy” conducted by Dr Julio Frenk From Economist to Public Health practitioners • What are the leading causes of death worldwide? • Women, men, children, adults, regions • Which are the health priorities? • Due to the magnitude of the problem, Is it enough to use mortality as measurement? • How can we select the best health interventions? • How we can know if our investments on health system are producing positive effects on the population health? • How can we improve the allocation of health resources (financial)? • Tension into UN agencies: lack of leadership from WHO • WHO “Health for all” 1987 • WB “Investing in health, 1993” • Easy Questions, hard to answer: If HIV/AIDS is the first cause of death, what is the next ?
Global Context before GBD • Public health statistics, which were partial and fragmented • Estimates for numbers of people that die or impacted by disease, which were in some cases exaggerated beyond plausible limits or missing estimates entirely • Traditional health statistics did not allow policy-makers to compare relative cost-effectiveness of different interventions across diseases • Many reports were influenced by politics which diluted truth and prevented effective intervention
GBD 1990 • First GBD commissioned by World Bank, published : • 1993 WDR (WB) Investing in Health • 1994 WHO, Setting Health Priorities • 1996: GBD and GHS • Produced estimates for 1990 and projections to 2020 • Led by Christopher Murray and Alan Lopez - Disentangled epidemiology from advocacy in order to produce objective, plausible estimates • Measured burden of mortality and non-fatal conditions in a metric that could be compared across diseases (DALY), ages, and regions
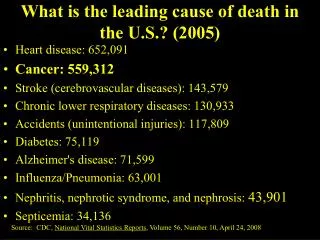
% Ischemic heart disease 12.4 Cerebrovascular disease 8.7 Lower respiratory infec 8.5 Diarrhoeal diseases 5.8 Perinatal conditions 4.8 C.O.P.D. 4.4 Tuberculosis 3.9 Measles 2.1 Road traffic accidents 2.0 Lung Cancer 1.9 Leading Causes of Death and DALYs 1990 DALYs Deaths % Lower Respinfec. 8.2 Diarrhoeal diseases 7.2 Perinatal conditions 6.7 Depression 3.7 Ischemic Heart Dis 3.4 Cerebrovascular Dis 2.8 Tuberculosis 2.8 Measles 2.6 Road traffic accidents 2.5 Congenital anomalies 2.4 Source: Murray and Lopez, 1996
UPDATES of BOD 1990 • Since 1998, WHO has produced annually up to dates of the GBD, publishing them in the Statistical Annexes of the WHR, as well in the web site www.who.int • From the 8 original regions WHO increased them to 14 • Updates of epidemiological estimates of TB, Malaria, HIV/AIDS, Neuropsychiatric diseases, were produced for the GBD 2000 • In order to increase the theory and methods of summary measures, WHO published a book in 2002
Comparative Risk Assessment The second round of estimates of the Attributable Burden due to some risk factors was initiated in 2001. That study expanded the number of risk factors from 10 to 29. The results were published in WHR 2002, and the detail literature review and methods in 2004
Disease Control Priorities II (2006) New estimates of GBD for 2001, based on the WHO revisions and more deatil sensitivity analysis Includes more documentation of diseases and risk factor estimates
Chile, Costa Rica, Peru, Ecuador Turkey Iran Tanzania, Mozambique Morocco, Tunisia, etc., etc.
Outline • What is “GBD” • GBD in the last 20 years • GBD 2005 is not only an update of the year of reference • Where is GBD making contributions to global health
Why a new GBD study Reasons for executing a new round • Methods advances for mortality measurement, cause of death attribution, modelling missing data, DW estimation and data collection techniques • Need for new tools, approaches to share results of GBD study with diverse audiences • Involve collaboration of many more people Demand for burden data from governments, funders, policy makers Only piecemeal revisions of epidemiology for conditions since 1996 No comprehensive revision of disability weights since 1996 (most criticized part of study) No consistent time trend available (methods for ‘00, ‘01, ‘02 not comparable to ‘90)
GBD 2005 New Round - Funded by the Bill and Melinda Gates Foundation - Started September 2007, Ending November 2010 Objectives - Produce specific DALY, YLL, and YLD estimates for over 220+ diseases/injuries and 40+ risk factors by age range, sex, and for 21 regions for the years 1990 and 2005. - Create simplified analytical tools to facilitate national burden estimates and policy use
Who are the key participants Organization Core Team External Advisory Board Tools and Curricula Development Sub-Team YLD Sub-Team Rafael Lozano and Colin Mathers CRA Sub-Team Majid Ezzati COD Sub-Team R Lozano, M Naghavi Mortality Sub-Team Alan Lopez and Chris Murray DW Sub-Team Josh Salomon and Colin Mathers Cluster E Noncommunicable Diseases Catherine Michaud Harvard University Cluster D Communicable Diseases Neff Walker Johns Hopkins University Cluster B Child/Maternal Bob Black Johns Hopkins University Cluster A CVD, COPD, Cancer Majid Ezzati Harvard University Cluster C Injuries and Mental Health Theo Vos University of Queensland
How is the work done at IHME contributing to the study Epidemiological Estimates Mortality DISMOD COD Disability Weights YLL DALY YLD
Mortality Envelopes • Deaths by age, sex and GBD region • Contains the number of deaths for all causes • Death is attributed to one cause • Estimated using all-cause mortality data • Child mortality (0-4) estimated separately Synthesis Assessing and adjusting for incompleteness Vital Registers* Estimation Process: Envelopes Adjusting for biases Surveys Models
Estimation Process: Adults Adjusting for Incompleteness in VR • Death Distribution Methods (DDM) • Demographers long-used tools for assessing level of completeness in death registration • 3 families • Many variants Adjusting For Biases • Survey Data: Sibling Survival Model Models: Predicting adult mortality • Leverage relationship between adult and child mortality • Build model, predict logit (45q15) for Males and Females separately (HIV prevalence, TFR, Country or Regional FE, Adjustment for post-Soviet collapse
Objectives 24 to 36 causes for 200 countries and territories (IHME) • To produce estimates of selected causes of death by country, age and sex. • To produce estimates of causes of death, based in GBD cause list for 21 GBD regions by age and sex, 1990 and 2005. • To produce friendly tools to aid cause of death estimates: • Mapping ICD across time and populations • Redistribution of garbage codes • Modeling causes of death for countries without VR 268 causes for 21 GBD new regions CODMOD
CODMOD level B (36) CODMOD level 2 (24) Mapping GBD Cause List with ICD Revisions and Other Tabulated List GBD 2005 Cause List (268 ) GBD 1990 Cause List (100) BTL 10 Tab 1 2 3 4 5 Tab B 6,7 Tab A 8 9 VA 10 9 tab ICD and other formats
Availability of COD data More than 4550 country-years
Distribution of Garbage Codes by Type and Region • ~20% total deaths from VR are GCs • 10 causes accumulate 75% • Intermediate causes • are the most important Garbage Codes 35.0 30.0 Specials Immediate Sequelae 25.0 Intermediate I&D UNS Cancer 20.0 % of GC Ill Def 15.0 10.0 5.0 0.0 SSA Asia LA Europe C&E ALL Europe W Caribbean N.America Australasia
Percent of deathswithgarbagecodesSelectCountries of theAmericas, circa 2005
Mortalidad por códigos basura en países de la región, 1979-2007 Guatemala Grenada El Salvador Barbados Argentina Surinam T&T Belice
The Problem is how to predict CoD for 100 countries without VR data • Data quality • Sparseness : Approximately 75% of total country-years missing • Compositional bias • Both sampling and non-sampling error • Sometimes multiple (discrepant) observations per country-year • Poor covariates • No global time-series available for many important covariates • The covariates we do have fail to explain much of the variation in the data • Need predictions • Not only do we need to fit the data we have, but we need to forecast forward (and backwards in many cases) How to maximize our use of all the data available?
How is the work done at IHME contributing to the study Epidemiological Estimates Mortality Disability Weights DisMod COD YLL DALY YLD
GBD schematic for neonatal infections Dead 2 1 Prenatal risk factors Neonatal infections 2 2 Sepsis Pneumonia Intrapartum risk factors 2 Meningitis 4 Postnatal risk factors 3 Exclude? Sequalae* Mild, moderate, severe Single or multi-domain Full recovery Parameters for disease model Incidence of the condition Case-fatality rate Case-complication rate (risk of sequelae) & distribution of severity of sequelae Complication-fatality rate 1 2 3 4
Neonatal infections incidence – Searches and data selection • DATABASES • PubMed, Embase, Web of Science, Popline, WHO regional databases + Reference lists and Key Review articles SEARCH TERMS Infection OR Sepsis OR Pneumonia OR Meningitis + Variables of Interest (eg. Incidence etc.) Limits: Publication Date from 1990 to 2008 Total search results (6518) Studies remaining after screening title or abstract (n=833) Excluded studies Pending Translation (n= 23) Did not meet criteria (n= 532) Unavailable {now coming from Boston] (n= 64) 214 papers entered Studies with live births (n=99) Studies without live births (n=115) Clinical sepsis incidence Reported (n=1) Culture proven sepsis incidence Reported (n=8) Clinical sepsis incidence reported (n=24) Culture proven sepsis incidence Reported (n=48) Sepsis Case fatality Rate Reported (n=23) Sepsis Case fatality Rate Reported (n=19)
Data availability for neonatal infections according to countries grouped by level of NMR Higher NMR settings have higher incidence of sepsis and higher case fatality
Expert Groups and Epidemiological Estimates Lots of work for these groups (systematic review example) Maternal Conditions Expert Group • Reasons for exclusion • 57% – no relevant data • 15% – sample size<200 • 11% – no dates reported • 17% – other reasons
Alcohol-attributable disease and injury 2002 (green mainly protective) • Chronic disease: • Cancer: Mouth & oropharyngeal cancer, esophageal cancer, liver cancer, female breast cancer • Neuropsychiatric diseases: Alcohol use disorders, unipolar major depression, primary epilepsy • Diabetes • Cardiovascular diseases: Hypertensive diseases, ischemic heart disease, ischemic stroke, hemorrhagic stroke • Gastrointestinal diseases: Liver cirrhosis • Conditions arising during perinatal period: Low birth weight, FAS • Injury: • Unintentional injury: Motor vehicle accidents, drownings, falls, poisonings, other unintentional injuries • Intentional injury: Self-inflicted injuries, homicide, other intentional injuries
New developments with respect to causality: inclusion of alcohol-attributable disease categories Colorectal cancer included (IARC monograph meeting; Baan et al., 2007) Tuberculosis/pneumonia incidence and worsening the disease course included (see next slides) HIV discussed but not included (not enough evidence for causality for incidence); enough evidence for alcohol worsening the disease cause, but not enough data to quantify Pancreatitis included (new disease category in GBD) Diverse new GBD injury categories (most injury categories have been causally linked to alcohol consumption) Revision of determination of risk relationship between alcohol consumption and primary epilepsy (excluding “alcoholic seizures” – in collaboration with epilepsy experts in GBD)
How is the work done at IHME contributing to the study Epidemiological Estimates Mortality Disability Weights DISMOD COD YLL DALY YLD
Generic Model of Disease States S: healthy (susceptible) C: diseased (condition of interest) D: dead from the disease M: dead from all other causes Transition rates i: incidence r: remission ƒ: case fatality m: all other mortality. • Limitations of DisMod I and II • Laborious Preprocessing • No Confidence Intervals • Ad-hoc approach to incorporating prior beliefs
DisMod III: A Bayesian Approach • Easier Preprocessing • Model-based confidence intervals • Systematic incorporation of prior beliefs
Deliverables and connections between the pieces Epidemiological Estimates Mortality Disability Weights DisMod COD YLL DALY YLD
Disability weights • Disability weights provide the bridge between mortality and non-fatal outcomes • Disability weights quantify overall health levels associated with different states, on a continuum between perfect health (d.w.=0) and death (d.w.=1) • GBD 1990: Six disability classes defined in reference to: • Four domains of disability (recreation, education, procreation, occupation) • Activities of daily living (e.g. eating, personal hygiene) • Instrumental activities of daily living (e.g. meal preparation, housework)