Download
1 / 29
290 likes | 454 Vues
1. 1. During rush hour, there is traffic congestion in the Cross Harbour Tunnel (CHT). The government proposes the following plans to reduce this problem. 2. Plan I : Increase the tunnel toll of the CHT Plan II: Build a new tunnel which links North Point with Kowloon City. 3.

E N D
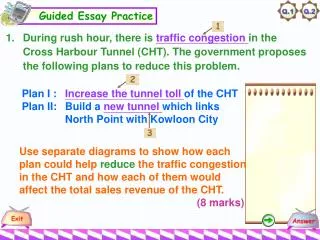
1 1. During rush hour, there is traffic congestion in the Cross Harbour Tunnel (CHT). The government proposes the following plans to reduce this problem. 2 Plan I : Increase the tunnel tollof the CHT Plan II: Build a new tunnel which links North Point with Kowloon City 3 Use separate diagrams to show how each plan could help reduce the traffic congestion in the CHT and how each of them would affect the total sales revenue of the CHT. (8 marks)
1 1. During rush hour, there is traffic congestion in the Cross Harbour Tunnel (CHT). The government proposes the following plans to reduce this problem. 2 Plan I : Increase the tunnel tollof the CHT Plan II: Build a new tunnel which links North Point with Kowloon City What does “traffic congestion” mean? 1 3 Use separate diagrams to show how each plan could help reduce the traffic congestion in the CHT and how each of them would affect the total sales revenue of the CHT. (8 marks)
1 1. During rush hour, there is traffic congestion in the Cross Harbour Tunnel (CHT). The government proposes the following plans to reduce this problem. 2 Plan I : Increase the tunnel tollof the CHT Plan II: Build a new tunnel which links North Point with Kowloon City What will happen to the quantity demanded of CHT service? 2 3 Use separate diagrams to show how each plan could help reduce the traffic congestion in the CHT and how each of them would affect the total sales revenue of the CHT. (8 marks)
1 1. During rush hour, there is traffic congestion in the Cross Harbour Tunnel (CHT). The government proposes the following plans to reduce this problem. 2 Plan I : Increase the tunnel tollof the CHT Plan II: Build a new tunnelwhich links North Point with Kowloon City What will happen to the demand for CHT service? 3 3 Use separate diagrams to show how each plan could help reduce the traffic congestion in the CHT and how each of them would affect the total sales revenue of the CHT. (8 marks)
P S D D 0 Q Qs The congestion of CHT can be described as an e_________d_________ at the given toll set b_________ the equilibrium price. (1 mark) 1
P S D D 0 Q Qs The congestion of CHT can be described as an e_________d_________ at the given toll set b_________ the equilibrium price. (1 mark) 1 What does “traffic congestion” mean? 1
P S D D 0 Q Qs The congestion of CHT can be described as an e_________d_________ at the given toll set b_________ the equilibrium price. (1 mark) 1 elow xcess emand P1 excess demand Qd
P S P1 excess demand at P1 D Q 0 Q0 Q1 Plan I: Increase the tunnel toll in the CHT 2 The increase in the toll (from P1 to P2) will r___________ the excess demand (lower quantity demanded from Q1 to Q2).
P S P1 excess demand at P1 D Q 0 Q0 Q1 Plan I: Increase the tunnel toll in the CHT 2 The increase in the toll (from P1 to P2) will r___________ the excess demand (lower quantity demanded from Q1 to Q2). What will happen to the quantity demanded of CHT service? 2
P S P1 excess demand at P1 D Q 0 Q0 Q1 Plan I: Increase the tunnel toll in the CHT 2 The increase in the toll (from P1 to P2) will r___________ the excess demand (lower quantity demanded from Q1 to Q2). educe excess demand at P2 P2 Q2
P S excess demand at P2 P1 P2 excess demand at P1 D Q 0 Q0 Q1 Q2 Plan I: Increase the tunnel toll in the CHT 2 Yet it does not affect the quantity transacted (Q0) and, hence, the total sales revenue will i_________ as shown by the shaded area. (1 mark)
P S excess demand at P2 P1 P2 excess demand at P1 D Q 0 Q0 Q1 Q2 Plan I: Increase the tunnel toll in the CHT 2 Yet it does not affect the quantity transacted (Q0) and, hence, the total sales revenue will i_________ as shown by the shaded area. (1 mark) What will happen to the quantity demanded of CHT service? 2
P S excess demand at P2 P1 P2 excess demand at P1 D Q 0 Q0 Q1 Q2 Plan I: Increase the tunnel toll in the CHT 2 Yet it does not affect the quantity transacted (Q0) and, hence, the total sales revenue will i_________ as shown by the shaded area. (1 mark) ncrease Gain in revenue Q2
P S excess demand given D1 P1 D1 Q 0 Q0 Q1 Plan II: Build a new tunnel which links North Point with Kowloon City 3 As a new s____________ is available, the demand for the CHT will d_________. Excess demand will thus decrease.
P S excess demand given D1 P1 D1 Q 0 Q0 Q1 Plan II: Build a new tunnel which links North Point with Kowloon City 3 As a new s____________ is available, the demand for the CHT will d_________. Excess demand will thus decrease. What will happen to the demand for CHT service? 3
P S excess demand given D1 P1 D1 D2 Q 0 Q0 Q1 Plan II: Build a new tunnel which links North Point with Kowloon City 3 As a new s____________ is available, the demand for the CHT will d_________. Excess demand will thus decrease. ubstitute ecrease excess demand given D2 Q2
P S excess demand given D1 P1 excess demand given D2 D1 D2 Q 0 Q0 Q1 Q2 Plan II: Build a new tunnel which links North Point with Kowloon City 3 Since the quantity transacted remains unchanged, the total sales revenue of the CHT will be u____________. (1 mark)
P S excess demand given D1 P1 excess demand given D2 D1 D2 Q 0 Q0 Q1 Q2 Plan II: Build a new tunnel which links North Point with Kowloon City 3 Since the quantity transacted remains unchanged, the total sales revenue of the CHT will be u____________. (1 mark) What will happen to the demand for CHT service? 3
P S excess demand given D1 P1 excess demand given D2 D1 D2 Q 0 Q0 Q1 Q2 Plan II: Build a new tunnel which links North Point with Kowloon City 3 Since the quantity transacted remains unchanged, the total sales revenue of the CHT will be u____________. (1 mark) nchanged Revenue remains unchanged
2. The economic recession in Hong Kong during the period of 1998 to 2000 caused a great decrease in the number of taxi passengers. On the other hand, the taxi fare is fixed by the government. Empty taxis could be found quite often. 1 With the aid of a diagram, explain what will happen to the total sales revenue of taxi services if there is a significant economic recovery.(7 marks) 2
2. The economic recession in Hong Kong during the period of 1998 to 2000 caused a great decrease in the number of taxi passengers. On the other hand, the taxi fare is fixed by the government. Empty taxis could be found quite often. Identity the economic phenomenon behind this. 1 1 With the aid of a diagram, explain what will happen to the total sales revenue of taxi services if there is a significant economic recovery.(7 marks) 2
2. The economic recession in Hong Kong during the period of 1998 to 2000 caused a great decrease in the number of taxi passengers. On the other hand, the taxi fare is fixed by the government. Empty taxis could be found quite often. What is the effect upon the demand for taxi services? 2 1 With the aid of a diagram, explain what will happen to the total sales revenue of taxi services if there is a significant economic recovery.(7 marks) 2
P S D1 0 The presence of empty taxis everywhere implies an _________________ of taxi services. The excess supply is caused by _____________________________________ _______________________. (2 marks) 1
P S D1 0 The presence of empty taxis everywhere implies an _________________ of taxi services. The excess supply is caused by _____________________________________ _______________________. (2 marks) 1 Identity the economic phenomenon behind this. 1
The presence of empty taxis everywhere implies an _________________ of taxi services. The excess supply is caused by _____________________________________ _______________________. (2 marks) 1 excess supply the fixed taxi fare (Pf) set above the equilibrium price P S Pf D1 0 Q1
The original amount of services transacted is Q1. The total revenue is Q1 x Pf. The economic recovery would lead to an ___________ in demand from D1 to D2 and the amount of services transacted would also _______________to Q2. As a result, the total revenue rises from Pf x Q1 to Pf x Q2 (increases by the shaded area). (2 marks) 2 P S Pf D1 0 Q1
The original amount of services transacted is Q1. The total revenue is Q1 x Pf. The economic recovery would lead to an ___________ in demand from D1 to D2 and the amount of services transacted would also _______________to Q2. As a result, the total revenue rises from Pf x Q1 to Pf x Q2 (increases by the shaded area). (2 marks) 2 What is the effect upon the demand for taxi services? 2 P S Pf D1 0 Q1
D2 The original amount of services transacted is Q1. The total revenue is Q1 x Pf. The economic recovery would lead to an ___________ in demand from D1 to D2 and the amount of services transacted would also _______________to Q2. As a result, the total revenue rises from Pf x Q1 to Pf x Q2 (increases by the shaded area). (2 marks) increase 2 increase from Q1 P S 3 Pf + D1 0 Q2 Q1
D2 The original amount of services transacted is Q1. The total revenue is Q1 x Pf. The economic recovery would lead to an ___________ in demand from D1 to D2 and the amount of services transacted would also _______________to Q2. As a result, the total revenue rises from Pf x Q1 to Pf x Q2 (increases by the shaded area). (2 marks) increase 2 increase from Q1 The maximum capacity of taxi services is restricted by the number of taxi licences. 3 P S 3 Pf + D1 0