Download
1 / 30
320 likes | 461 Vues
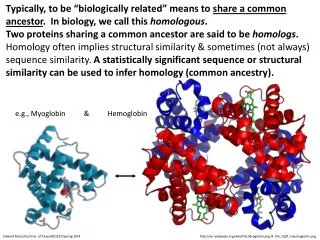
Learn the biological functions, structures, and differences between myoglobin and hemoglobin, their heme components, and oxygen binding mechanisms. Understand oxygen binding curves, cooperative regulation, and structural changes in hemoglobin. Explore modifiers of oxygen binding, like chloride anions, 2,3-BPG, CO2, and NO. Written in English.

E N D
Myoglobin and Hemoglobin BL4010 10.12.06
Myoglobin & Hemoglobin Objectives • Identify biological functions. • Identify parts of Mb & their roles in O2 transport. • Identify how Hb differs from Mb.
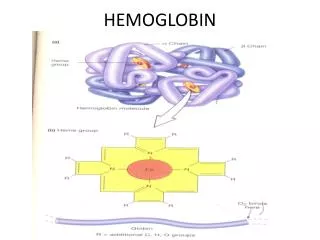
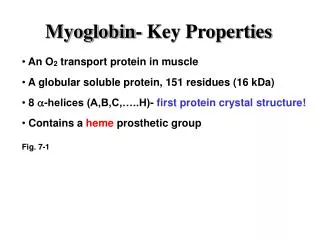
Myoglobin • O2 transport, storage in cells. • Two parts: protein and heme prosthetic group. • Protein: • 155 amino acids, ~ 17 kDa. • Compact, globin fold. • 75% helix.
Heme • Heme is composed of porphyrin and Fe2+. • Porphyrin is non-polar, except two proprionate groups. • Porphyrin binds O2, CO. • CO 10,000x tighter than O2.
Heme Ligands • Fe is 6-coordinate. • Four N of heme group • One N from proximal His. • One from H2O or O2. • Can also bind CO.
carboxyl group of proprionate. Heme – Protein Interaction • Heme stabilizes protein fold. • Binds through hf interactions • Prooprionate groups on surface.
Myoglobin • Protein completely surrounds heme. • Function of protein: • ↑ heme solubility. • ↓ heme oxidation (Fe2+ → Fe3+) • metmyoglobin inactive. • ↓ CO binding.
O O O O C C Fe Fe Fe O2 vs. CO binding. • CO binds tightly; linear. • O2 binds less tightly, bent structure. • Distal His forces bent binding of both, weakens CO binding. Distal His Proximal His
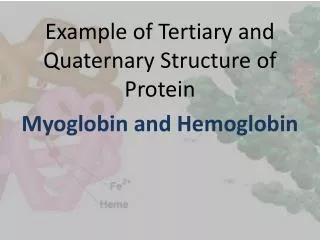
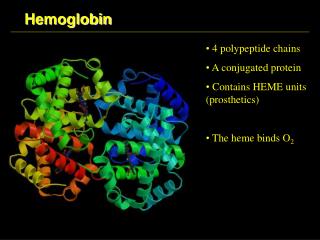
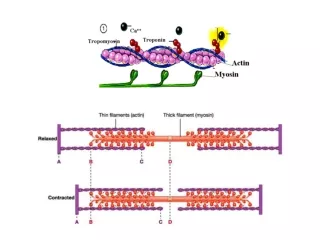
Hemoglobin • Tetrameric protein • Dimer of dimers, (ab)2 • a,b chains resemble Mb. • Each chain contains, heme, prox. histidine. • Each binds 1 eq. O2. • ab dimer interface different from aa, bb interface. • Marked by salt bridges that stabilize the deoxy structure.
Oxygen Binding Curves Objectives. • Understand O2 binding curve for Mb. • Understand O2 binding curve for Hb. • Identify mechanism of cooperative binding.
Quantify O2 binding. • Measure deoxy- vs. oxy by visible absorption (Soret band). • Reaction is Mb + O2 MbO2 • Equil. Const. given by: Ka = [MbO2]/[Mb][O2] • Plot fraction bound: Y = [MbO2] / ([Mb] + [MbO2]) • Recast in terms of measureable quantities: Y = pO2 / (pO2 + pO2,50)
Direct Plots • Plot fractional saturation versus partial pressure of O2. • Most relevant part of plot in range of cell pO2 (~ 15-25 mm Hg).
Direct Plot • Binding characterized by pO2,50. • Partial pressure of O2 where Mb is half saturated. • If lower oxygen affinity, curve shifts right; if higher, curve shifts left. pO2,50 = 3 mm Hg.
4° Structure of Hb alters O2 binding. • Interactions between dimers alters oxygen binding. • Direct plot shows Hb has lower affinity than Mb. • Sets up delivery system. • O2 bound by Hb in lungs; released in tissues. Mb Hb
Cooperative regulation Hb oxygen binding: • Start binding with given affinity in deoxy state, subsequent binding enhances affinity. • Defines positive cooperative regulation. • Only seen in multi-domain proteins. • Hill coefficient ~ number of interacting subunits. Advantage: binding is more sensitive to small changes in [ligand].
R T Molecular Model • In deoxy state, Fe out of heme plane; domed. • Bind O2, moves Fe. • This moves proximal His and its helix. • Moving helix alters a/b interface. • Deoxy = Tense (T) • Oxy = Relaxed (R)
T → R Structural Changes. R form: • All are broken. T form: • H143 - D94 in b1. • K40 - H146 CO2-. • R141 - D126 a2/a1. oxy deoxy
Small changes translate to large movements. Deoxy State
Modifying O2 Binding in Hb Objectives. • Identify allosteric effectors • Describe molecular basis of each.
log Q D94 H146 log pO2 Bohr Effect • Oxygen affinity sensitive to pH. • ↓ pH; ↑ pO2,50 (lowers sensitivity). • D94 ↔ H146 salt bridge in T state only. • Excess H+ forms salt bridge, favors deoxy state.
log Q R-NH2 + CO2 R-NH-CO2- + H+ In lungs, Low CO2 log pO2 In tissues, High CO2 CO2 • Produced during aerobic metabolism. • Reacts with N terminal amino; carbamylation reaction. • Negative charge forms salt bridge with aR141, stabilizes deoxy state.
CO2 is Coupled to Bohr Effect In Tissue • CO2 is bound by Hb or converted to bicarbonate by carbonic anhydrase. • Buffers blood pH. • Hb binds 2H+ / 4 O2 released, also buffers (Bohr effect). In Lungs • Low pCO2; reaction reverses; • CO2 and H+ released from Hb, • pO2,50 decreased (increased oxygen affinity). From Lange’s Biochemistry
Chloride Anion Binding • Also favors T state • Forms salt bridge with R141, V1 in T state. • Released in R state.
2,3-BPG • Side product of glycolysis. • indicates active respiration, need O2. • Binds cationic region in T-form. • Favors deoxy, releases O2 to tissues. • [2,3-BPG] is high, responsible for observed pO2,50 of 27 mm Hg. • stripped Hb has pO2, 50 ~ 8 mm Hg.
Another look at 2,3-BPG • BPG acts as a “wedge” and drives the R state to the T state. • Forces release of bound O2 in active tissue. • BPG increases at high altitude.
NO potent vasodilator Produced by Nitric Oxide Synthase (NOS). Arginine → Citrulline + NO Activates soluble guanylyl cyclase, signal transduction cascade. Reacts with Hb, which inactivates the NO (can’t react with sGC). Interactions with Hb Binds to HbO2 to form nitrates (NO3-) Binds to deoxy-Hb to form iron-nitrosyl (Fe2+-NO). Rapid reaction in vitro, but slow in vivo due to nature of blood flow along endothelium and diffusional barriers. NO and Hb
NO also binds to Cys93 on b-chains. Forms S-NO bond (SNO-Hb). Transfers NO to glutathione, which functions as a storage form for NO (won’t react with HbO2). Transport of NO by Hb
Transfer reaction depends on T/R state. R-state promotes binding to Cys93 SNO-Hb formed in lungs. NO released in T-state. Effectively delivers NO to vasculature. Vasodilation then enhances O2 delivery. But wait a minute … [SNO-Hb] 10,000 x lower than HbO2. NO transfer from SNO-Hb is slow. Amount released can’t compete with NO produced by NOS in erythrocytes. NO transport by Hb
Clinical relevance • If NOS impaired, SNO-Hb is effective transport, O2 delivery system. • Therapeutic value in treatment of sickle cell? • Use in blood substitutes?