Download
1 / 17
170 likes | 345 Vues
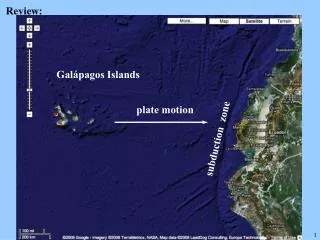
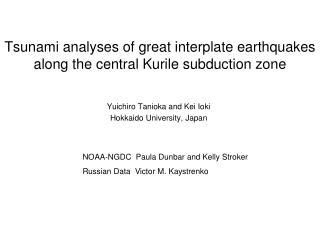
Tsunami analyses of great interplate earthquakes along the central Kurile subduction zone. Yuichiro Tanioka and Kei Ioki Hokkaido University, Japan. NOAA-NGDC Paula Dunbar and Kelly Stroker Russian Data Victor M. Kaystrenko.

E N D
Tsunami analyses of great interplate earthquakes along the central Kurile subduction zone Yuichiro Tanioka and Kei Ioki Hokkaido University, Japan NOAA-NGDC Paula Dunbar and Kelly Stroker Russian Data Victor M. Kaystrenko
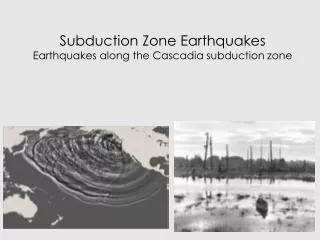
Recent large interplate earthquakes along the Kurile-Kamchatka subduction zone
Source models for the 2006 central Kurile earthquake The slip distribution estimated using teleseismic body waves (Yamanaka, ERI note, 2006) The slip distribution estimated using tsunami waveforms (Fujii and Satake, 2007)
Source area of the 2006 Kurile earthquake Source area of the 1963 Kurile earthquake estimated by Kanamori (1970)
Alaska Russia Japan Tsunami waveforms at tide gauges at Islands in Pacific were obtained from NOAA-NGDC
Source area of the 2006 Kurile earthquake subfaults length 50km width 50km strike 223 ° dip 22 ° rake 90 °
1 2 3 4 5 6 7 8 9 10 11 12 13 14 15 ° subfault numbers 19 16 20 17 21 18
observed waveform computed waveform data used in the inversion Comparison of observed and computed tsunami waveforms. The horizontal axis is time in minutes from the origin time of the earthquake. The vertical axis is amplitude in cm.
observed waveform computed waveform data used in the inversion Comparison of observed and computed tsunami waveforms. The horizontal axis is time in minutes from the origin time of the earthquake. The vertical axis is amplitude in cm.
Total seismic moment estimated from the slip distribution was 4.6×10²¹ Nm (Mw 8.4).
Tsunami waveforms at tide gauges in Japan and USA USA tide gauge records are collected from NOAA-NGDC Choshi Chichijima Honolulu San Francisco
1 3 4 5 2 Five source models for the 1918 Kurile earthquake 2006central Kurile earthquake 1963Kurile earthquake fault length 100km fault width100km strike 230° dip 20° rake90° Source models for the1918 Kurile earthquake
1 3 4 5 Chichijima Choshi Chi 2006central Kurile earthquake 1963Kurile earthquake Source models for the1918 Kurile earthquake 2 Honolulu San Francisco The best source model is model 2 The differences between observed and computed arrival times are less than 20 minutes
Chichijima Choshi Model 5 Observed tsunami arrival times at Chichijima and Honolulu are not explained at all by computed ones, although those at Choshi and San Francisco are explained well. Honolulu San Francisco
The source area of the 1918 Kurile earthquake is closer to that of the 2006 Kurile earthquake than that of the 1963 Kurile earthquake. The slip amount estimated from the comparison of observed and tsunami waveforms for the 1918 Kurile earthquake is 6.6 m. The seismic moment for the 1918 Kurile earthquake is calculated to be 4.6x10²¹Nm(Mw 8.4). 2006central Kurile earthquake 1918 Kurile earthquake 1963Kurile earthquake
Conclusions The 1963 Kurile earthquake 1) The large slip occurred the plate interface near the trench. 2) The largeslip area is the same as the source area estimated by Kamamori (1970). 3) Total seismic moment estimated from the slip distribution was 4.6×10²¹ Nm (Mw 8.4). The 1918 Kurile earthquake 1) The source area of the 1918 Kurile earthquake is closer to that of the 2006 Kurile earthquake 2) The seismic moment for the 1918 Kurile earthquake is calculated to be 4.6x10²¹Nm(Mw 8.4).