Download
1 / 55
550 likes | 642 Vues
Learn about model fitting challenges and key statistical concepts in x-ray astronomy, including Poisson distribution, likelihood maximization, and assessing fit quality. This guide covers important properties of distributions, the Poisson distribution, and fitting counts spectra using examples and figures.

E N D
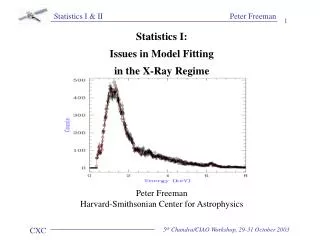
Statistics I: Issues in Model Fitting in the X-Ray Regime Peter Freeman Harvard-Smithsonian Center for Astrophysics
Glossary of Important Notation • D : a dataset • Di : the datum of bin i of the dataset • N : the number of bins in the dataset • B : a background dataset associated with D • Bi : the datum of bin i of the background dataset • M = M(): a model with free parameters • : the vector of best-fit model parameters • P : the number of (freely varying) model parameters • Mi : the convolved model amplitude in bin i • μ: the mean of a distribution • V : the variance of a distribution • : the standard deviation of a distribution • E[X ]: the expectation of variable X • L: the likelihood • L: the log-likelihood logL • 2: the “chi-square” statistic
Definitions • Random variable: a variable which can take on different numerical values, corresponding to different experimental outcomes. • Example: a binned datum Di, which can have different values even when an experiment is repeated exactly. • Statistic: a function of random variables. • Example: a datum Di, or a population mean • Probability sampling distribution: the normalized distribution from which a statistic is sampled. Such a distribution is commonly denoted p(X|Y), “the probability of outcome X given condition(s) Y,” or sometimes just p(X). Note that in the special case of the Gaussian (or normal) distribution, p(X) may be written as N(μ,2), where μis the Gaussian mean, and 2 is its variance.
Properties of Distributions The beginning X-ray astronomer only needs to be familiar with four properties of distributions: the mean, mode, variance, and standard deviation, or “error.” • Mean: μ = E[X ] = dX X p(X) • Mode: max[p(X)] • Variance: • Error: Note that if the distribution is Gaussian, then is indeed the Gaussian (hence the notation). If two random variables are to be jointly considered, then the sampling distribution is two-dimensional, with shape locally described by the covariance matrix: where The related correlation coefficient is The correlation coefficient can range from -1 to 1.
Figure 1: Top: example of a joint probability sampling distribution for two random variables. Bottom: the marginal sampling distribution p(x) = dy p(x,y) (Eadie et al. 1971, p. 16).
The Poisson Distribution In the remainder of this class, we will concentrate exclusively upon fitting counts spectra, i.e., fitting data sampled from the Poisson distribution. Things to remember about the Poisson distribution: • μ= E [Di] = Mi ; • V [Di] = Mi; • cov[Di1, Di2] = 0; • the sum of n Poisson-distributed variables (found by, e.g., combining the data in n bins) is itself Poisson-distributed with variance ; and • as , the Poisson distribution converges to a Gaussian distribution N (μ = Mi ; 2 = Mi ). The discrete Poisson distribution gives the probability of finding exactly Di events in bin i of dataset D in a given length of time, if the events occur independently at a constant rate Mi.
Figure 2: Integer counts spectrum sampled from a constant amplitude model with mean μ= 60 counts, and fit with a parabolic model.
Figure 3: Example of a two-dimensional integer counts spectrum. Top Left: Chandra ACIS-S data of X-ray cluster MS 2137.3-2353, with ds9 source regions superimposed. Top Right: Best-fit of a two-dimensional beta model to the filtered data. Bottom Left: Residuals (in units of ) of the best fit. Bottom Right: The applied filter; the data within the ovals were excluded from the fit.
Figure 4: Comparison of Poisson distributions (dotted) of mean μ = 2 and 5 with normal distributions of the same mean and variance (Eadie et al. 1971, p. 50).
Figure 5: Comparison of Poisson distributions (dotted) of mean μ = 10, 25 and 40 with normal distributions of the same mean and variance (Eadie et al. 1971, p. 50).
Assessing the Quality of Fit One can use the Poisson distribution to assess the probability of sampling a datum Di given a predicted (convolved) model amplitude Mi. Thus to assess the quality of a fit, it is natural to maximize the product of Poisson probabilities in each data bin, i.e., to maximize the Poisson likelihood: In practice, what is often maximized is the log-likelihood, L = logL. A well-known statistic in X-ray astronomy which is related to L is the so-called “Cash statistic”:
(Non-) Use of the Poisson Likelihood In model fits, the Poisson likelihood is not as commonly used as it should be. Some reasons why include: • a historical aversion to computing factorials; • the fact the likelihood cannot be used to fit “background subtracted” spectra; • the fact that negative amplitudes are not allowed (not a bad thing physics abhors negative fluxes!); • the fact that there is no “goodness of fit" criterion, i.e. there is no easy way to interpret Lmax (however, cf. the CSTAT statistic of Sherpa); and • the fact that there is an alternative in the Gaussian limit: the 2 statistic.
The 2 Statistic • Step 1: write down the Poisson likelihood (in one bin). Here, we demonstrate the connection between the Poisson likelihood and the 2 statistic.1 • Step 2: apply Stirling’s approximation. • Step 3: look near, e.g., the log-likelihood peak, and • reparameterize in terms of 1The following is based on unpublished notes by Loredo (1993).
Validity of the c2 Statistic Summarizing the results shown on the last panel, if • Di>> 1 in every bin i, and • terms of order 3 and higher in the Taylor series expansion of L may be ignored, then the statistic c2 may be used to estimate the Poisson likelihood, and an observed value will be sampled from the c2 distribution for N - P degrees of freedom: Note that if N - P = 1, the c2 distribution diverges, while in the limit , it asymptotically approaches a Gaussian distribution with mean N - P and variance 2(N - P ). Also note that if PN , then the c2 distribution cannot be defined – you are doing something very wrong if you have more model parameters than data bins!
Validity of the c2 Statistic So, when can you safely use the c2 statistic instead of the maximum likelihood in your fits? This is a trick question - the answer is always. That's because you can run simulations to determine the distribution from which your observed value of c2 is sampled to quantitatively assess your fit. However, the whole reason one uses the c2 statistic is to avoid time-consuming simulations (and to use the c2 distribution directly)! That said, the rules: • A general rule-of-thumb says that c2 is sampled from the c2 distribution if there is a minimum of five counts in every bin. (But there is no standard reference for this in the literature, and the more counts, the better!) • Also, the fit must be good! Unfortunately, bad fits are common, even necessary, in X-ray astronomy; one example is the fit of a continuum model to data exhibiting an obvious (emission or absorption) line, done in an attempt to quantify how well the line is detected (a issue we'll return to later, when discussing model comparison). Inferences made using such fits can be suspect!
Figure 6: Examples of the c2 distribution for v = N - P = 1, 2, 3, 4, and 5 (Eadie et al. 1971, p. 64).
Versions of the c2 Statistic The version of c2 derived above is dubbed “data variance” c2 , or , because of the presence of D in the denominator. Generally, the c2 statistic is written as: where represents the (unknown!) variance of the Poisson distribution from which Di is sampled. c2 Statistic Data Variance Di Model Variance Mi Gehrels Primini Mi from previous best-fit Churazov based on smoothed data D “Parent” Least Squares 1 Note that some X-ray data analysis routines may estimate i for you during data reduction. In PHAfiles, such estimates are recorded in the STAT_ERR column.
Statistical Issues: Goodness-of-Fit • The c2 goodness-of-fit is derived by computing This can be computed numerically using, e.g., the GAMMQ routine of Numerical Recipes. • A typical criterion for rejecting a model is (the “95% criterion”). However, using this criterion blindly is not recommended! • A quick’n’dirty approach to building intuition about how well your model fits the data is to use the reducedc2, i.e., • A “good” fit has • If the fit is “too good” -- which means (1) the errorbars are too large, (2) is not sampled from the c2 distribution, and/or (3) the data have been fudged. The reduced c2 should never be used in any mathematical computation if you are using it, you are probably doing something wrong!
Figure 7: Comparison of the distributions of 500 sampled values of c2versus the expected distribution for 99 degrees of freedom. Top: c2with Gehrels variance. Bottom: c2with data variance.
Statistical Issues: Background Subtraction • A typical “dataset” may contain multiple spectra, one containing source and “background” counts, and one or more others containing only “background” counts. • The “background” may contain cosmic and particle contributions, etc., but we'll ignore this complication and drop the quote marks. • If possible, one should model background data: • Simultaneously fit a background model MB to the background dataset(s) Bj , and a source plus back- ground model MS + MB to the raw dataset D. • The background model parameters must have the same values in both fits, i.e., do not fit the background data first, separately. • Maximize LB LS+B or minimize • However, many X-ray astronomers continue to subtract the background data from the raw data: n is the number of background datasets, t is the observation time, and is the “backscale” (given by the BACKSCAL header keyword value in a PHA file), typically defined as the ratio of data extraction area to total detector area.
sherpa> data source.pi sherpa> back back.pi sherpa> source = xswabs[sabs]*pow[sp] sherpa> bg = xswabs[babs]*pow[bp] sherpa> statistic cash sherpa> fit # maximize L(B)*L(S+B) or minimize X^2(B)+X^2(S+B) ... powll: final function value = -7.01632E+03 sabs.nH 2.35843 10^22/cm^2 sp.gamma 1.48526 sp.ampl 0.00195891 babs.nH 0.671569 10^22/cm^2 bp.gamma 1.07225 bp.ampl 0.000107204 sherpa> projection ... -------------------------------------------------------- Parameter Name Best-Fit Lower Bound Upper Bound -------------------------------------------------------- sabs.nH 2.35732 -0.0981442 +0.150539 sp.gamma 1.48477 -0.0645673 +0.101794 sp.ampl 0.00195682 -0.000177659 +0.000317947
Figure 8: Top: Best-fit of a power-law times galactic absorption model to the source spectrum of supernova remnant G21.5-0.9. Bottom: Best-fit of a separate power-law times galactic absorption model to the background spectrum extracted for the same source.
Statistical Issues: Background Subtraction • Why subtract the background? • It may be difficult to select an appropriate model shape for the background. • Analysis proceeds faster, since background datasets are not fit. • “It won't make any difference to the final results.” • Why not subtract the background? • The data are not Poisson-distributed -- one cannot fit them with the Poisson likelihood. (Variances are estimated via error propagation: • It may well make a difference to the final results: • Subtraction reduces the amount of statistical information in the analysis quantitative accuracy is thus reduced. • Fluctuations can have an adverse effect, in, e.g., line detection.
Statistical Issues: Background Subtraction • Here, we repeat the fit from above, except that this time the data are background- subtracted: sherpa> data source.pi sherpa> back back.pi sherpa> subtract sherpa> statistic chi gehrels # can't use Cash! sherpa> fit ... powll: final function value = 1.88299E+02 sabs.nH 2.67251 10^22/cm^2 sp.gamma 1.74921 sp.ampl 0.00261343 sherpa> projection ... Computed for projection.sigma = 1 -------------------------------------------------------- Parameter Name Best-Fit Lower Bound Upper Bound -------------------------------------------------------- sabs.nH 2.67251 -0.202747 +0.214219 sp.gamma 1.74921 -0.14036 +0.144823 sp.ampl 0.00261343 -0.000475006 +0.000597735
Compare this with the previous result: -------------------------------------------------------- Parameter Name Best-Fit Lower Bound Upper Bound -------------------------------------------------------- sabs.nH 2.35732 -0.0981442 +0.150539 sp.gamma 1.48477 -0.0645673 +0.101794 sp.ampl 0.00195682 -0.000177659 +0.000317947
Statistical Issues: Rebinning • Rebinning data invariably leads to a loss of statistical information! • Rebinning is not necessary if one uses the Poisson likelihood to make statistical inferences. • However, the rebinning of data may be necessary to use c2 statistics, if the number of counts in any bin is <=5. In X-ray astronomy, rebinning (or grouping) of data may be accomplished with: • grppha, an FTOOLS routine; or • dmgroup, a CIAO Data Model Library routine. One common criterion is to sum the data in adjacent bins until the sum equals five (or more). • Caveat: always estimate the errors in rebinned spectra using the new data in each new bin (since these data are still Poisson-distributed), rather than propagating the errors in each old bin. • For example, if three bins with numbers of counts 1, 3, and 1 are grouped to make one bin with 5 counts, one should estimate V[D’= 5] and notV[D’] = V[D1 = 1] + V[D2 = 3] + V [D3 = 1]. The propagated errors may overestimate the true errors.
Statistical Issues: Bias • If one samples a large number of datasets from a given model and then fits this same model to these datasets (while letting vary), one will build up sampling distributions for each parameter k . • An estimator (e.g., c2) is biased if the mean of these distributions (E[k]) differs from the true values k,o. • The Poisson likelihood is an unbiased estimator. • The c2 statistic can be biased, depending upon the choice of : • Using the Sherpa utility FAKEIT, we simulated 500 datasets from a constant model with amplitude 100 counts. • We then fit each dataset with a constant model, recording the inferred amplitude. Statistic Mean Amplitude Gehrels 99.05 Data Variance 99.02 Model Variance 100.47 “Parent” 99.94 Primini 99.94 Cash 99.98
Figure 9: A demonstration of bias. Five hundred datasets are sampled from a constant model with amplitude 100 and then are fit with the same constant amplitude model, using c2 with data variance. The mean of the distribution of fit amplitude values is not 100, as it would be if the statistic were an unbiased estimator.
Statistical Issues: Systematic Errors • In X-ray astronomy, one usually speaks of two types of errors: statistical errors, and systematic errors. • Systematic errors are uncertainties in instrumental calibration. For instance: • Assume a spectrum observed for time t with a telescope with perfect resolution and an effective area Ai . Furthermore, assume that the uncertainty in Ai is A,i . • Neglecting data sampling, in bin i, the expected number of counts is Di= D,i(DE )tAi. • We estimate the uncertainty in Dias Di = D,i(DE )tA,I = D,i(DE )tfiAi = fiDi • The systematic error fiDi ; in PHA files, the quantity fi is recorded in the SYS_ERR column. • Systematic errors are added in quadrature with statistical errors; for instance, if one uses to assess the quality of fit, then • To use information about systematic errors in a Poisson likelihood fit, one must incorporate this information into the model, as opposed to simply adjusting the estimated error for each datum.
Methodologies It is important to note that the field of statistics may be roughly divided into two schools: the so-called “frequentist” (or classical) school, and the Bayesian school. • A frequentist assesses a model by first assuming that • M is the “true” model, and • are the “true” model parameter values, • and then comparing the probability of observing the dataset D with the probabilities of observing other datasets predicted by M . • A Bayesian assesses by comparing its probability (given the observed dataset D only) with the probabilities of other parameterized models, given D. We have been able to ignore the differences between the two methodologies when discussing model fitting, up to now.
Statistical Issues: Bayesian Fitting The centerpiece of the Bayesian statistical methodology is Bayes' theorem. As applied in a model fit, it may be written as where • p(D| ) is the likelihood L (which may be estimated as exp(-c2/2)); • p() is the prior distribution for , reflecting your knowledge of the parameter values before the experiment; • p(|D) is the posterior distribution for , reflecting your knowledge of the parameter values after the experiment; and • p(D) is an ignorable normalization constant. For now, keep in mind that a Bayesian is more interested in finding the mode of the posterior distribution than in determining the maximum likelihood! (Delving into the hurly-burly world of prior specification is beyond the scope of this class...which is now over!)
Statistics II: Model Comparison and Parameter Estimation Peter Freeman Harvard-Smithsonian Center for Astrophysics
Now, Shifting Gears… A model M has been fit to dataset D and either the maximum of the likelihood function Lmax, the minimum of the c2 statistic c2min, or the mode of the posterior distribution has been determined. What comes next? Model Comparison. The determination of which of a suite of models (e.g., blackbody, power-law, etc.) best represents the data. Parameter Estimation. The characterization of the sampling distribution for each best-fit model parameter (e.g., blackbody temperature and normalization), which allows the errors (i.e., standard deviations) of each parameter to be determined. Publication! Here, we cannot ignore the frequentist/Bayesian divide. Hence we will discuss how frequentists and Bayesians would complete these tasks, separately…
Frequentist Model Comparison Two models, M0andM1 , have been fit to D.M0, the “simpler” of the two models (generally speaking, the model with fewer free parameters) is the null hypothesis. A frequentist would compare these models by: • constructing a test statistic T from the best-fit statistics of each fit (e.g., ); • determining each sampling distributions for T, p(T| M0) and p(T | M1); • determining the significance, or Type I error, the probability of selecting M1when M0is correct: • and determing the power, or Type II error, which is related to the probability βof selecting M0 when M1 is correct: • If α is smaller than a pre-defined threshold (≤ 0.05, or ≤ 10-4, etc., with smaller thresholds used for more controversial alternative models), then the frequentist rejects the null hypothesis. • If there are several model comparison tests to choose from, the frequentist uses the most powerful one!
Figure 1: Comparison of distributions p(T| M0)(from which one determines the significance α) and p(T | M1) (from which one determines the power of the model comparison test 1 – β) (Eadie et al. 1971, p.217)
Frequentist Model Comparison Standard frequentist model comparison tests include: • The c2 Goodness-of-Fit (GoF) test: • The Maximum Likelihood Ratio (MLR) test: where ΔP is the number of additional freely varying model parameters in model M1. • The F-test: where P1 is the total number of thawed parameters in model M1, I is the incomplete beta function, and F is the F-statistic These are standard tests because they allow estimation of the significance without time-consuming simulations!
Frequentist Model Comparison Notes and caveats regarding these standard tests: • The GoF test is an “alternative-free” test, as it does not take into account the alternative model M1. It is consequently a weak (i.e., not powerful) model comparison test and should not be used! • Only the version of F-test which generally has the greatest power is shown above: in principle, one can construct three F statistics out of and Dc2 • The MLR ratio test is generally the most powerful for detecting emission and absorption lines in spectra. But the most important caveat of all is that…
Frequentist Model Comparison The F and MLR tests are commonly misused by astronomers! There are two important conditions that must be met so that an estimated derived value α is actually correct, i.e., so that it is an accurate approximation of the tail integral of the sampling distribution (Protassov et al. 2001): • M0 must be nested within M1, i.e., one can obtain M0 by setting the extra ΔP parameters of M1 to default values, often zero; and • those default values may not be on a parameter space boundary. The second condition may not be met, e.g., when one is attempting to detect an emission line, whose default amplitude is zero and whose minimum amplitude is zero. Protassov et al. recommend Bayesian posterior predictive probability values as an alternative, but a discussion of this topic is beyond the scope of this class. If the conditions for using these tests are not met, then they can still be used, but the significance must be computed via Monte Carlo simulations.
Bayesian Model Comparison In the previous class, we showed how Bayes’ theorem is applied in model fits. It can also be applied to model comparison: • p(M) is the prior probability for M; • p(D) is an ignorable normalization constant; and • p(D | M) is the average, or global, likelihood: In other words, it is the (normalized) integral of the posterior distribution over all parameter space. Note that this integral may be computed numerically, by brute force, or if the likelihood surface is approximately a multi-dimensional Gaussian (i.e. if Lα exp[-c2/2]), by the Laplace approximation: where C is the covariance matrix (estimated numerically at the mode).
Bayesian Model Comparison To compare two models, a Bayesian computes the odds, or odd ratio: where B10 is the Bayes factor. When there is no a priori preference for either model, B10 = 1 of one indicates that each model is equally likely to be correct, while B10≥ 10 may be considered sufficient to accept the alternative model (although that number should be greater if the alternative model is controversial).
Parameter Estimation One should speak of confidence or credible intervals or regions rather than “errors.” • A frequentist derives confidence intervals and regions. • A Bayesian derives credible intervals and regions. • An interval is a range (or ranges) of values of a parameter θ that has probability pint of containing the parameter’s true value θo . (A region is simply the multi-dimensional analogue of an interval.) • An infinite number of intervals can be defined for a given parameter: here, we’ll speak of intervals that contain the most probable parameter values.
Parameter Estimation Instead of the integrated probability pint, many speak of “numbers of σ.” One can convert from nσto pint using the following equation: Note: this conversion between pint and σ, while strictly true only if the sampling distribution is a one-dimensional Gaussian, is used by many astronomers in casual conversation regardless of the actual distribution shape or dimensionality.
Parameter Estimation • Tables showing Δc2as a function of integrated probability pint and number of degrees of freedom v = N – P can cause confusion. For instance: • “I have two free parameters in my model. Hence I should compute 68.3% confidence intervals for each parameter using Δc2 = 2.30, right?” • “No.” • To find the nσconfidence interval for one parameter, use Δc2 for v = 1 (or n2). • To find the nσ joint confidence region for m parameters, use Δc2 for v = m. • To find either an interval or region using the likelihood function L, use ΔlogL = Δc2/2. Δc2 as a Function of Confidence Level and Degrees of Freedom (Based on Press et al. 1986, p. 536.)
Parameter Estimation Never project a (properly estimated) region onto a parameter axis to estimate an interval! This always over-estimates the size of the interval.
Frequentist Parameter Estimation To determine confidence intervals and regions, a frequentist generally must simulate and fit new datasets to determine the sampling distributions for each model parameter. • If the true parameter values are unknown (which is usually the case), then a grid of model parameter values should be constructed, with a large number of datasets sampled at each grid point. • But the usual choice is to appeal to asymptotic behavior and sample datasets using This method may only be useful in limited circumstances, as >= 100 datasets should be sampled and fit for accurate results.
Frequentist Parameter Estimation One can estimate confidence intervals without having to use simulations if the χ2or log L surface in parameter space is “well-behaved,” i.e., if • the surface is approximately shaped like a multi-dimensional paraboloid; and • the best-fit point is sufficiently far from parameter-space boundaries. Three common ways of determining nσintervals are: • Varying a parameter’s value, while holding the values of all other parameters at their best-fit values, until • the same as above, but allowing the values of all other parameters are allowed to float to new best-fit values; and • computing where the covariance matrix and I, the information matrix computed at the best-fit point, is
Figure 2: Example of a “well-behaved” statistical surface in parameter space, viewed as a multi-dimensional paraboloid (c2, top), and as a multi-dimensional Gaussian (exp(-c2/2) ≈ L, bottom).
Figure 3: On the right, 1, 2, and 3σ contours determined for a statistical surface that is not “well-behaved” in parameter space. With such a surface, rigorous parameter estimation involves simulations (frequentist approach) or numerical integration of the surface (Bayesian approach). From Freeman et al. (1999).
Frequentist Parameter Estimation Things to keep in mind about these confidence interval estimators (dubbed UNCERTAINTY, PROJECTION, and COVARIANCE in Sherpa, respectively): • The first method will always underestimate the interval if the value of the parameter of interest is correlated with other model parameter values. • The second method (which is relatively slow) is in a rigorous sense no more accurate than the third method (which is fast), but it does provide a means of visualizing the statistical surface. • A statistical surface is “well-behaved” if the second and third methods give the same interval estimates. • The condition that the best-fit point be sufficiently far from parameter-space boundaries means that these methods are not appropriate for determining upper or lower limits.
Example with a Well-Behaved Parameter Space sherpa> fit powll: v1.2 powll: initial function value = 8.22297E+01 powll: converged to minimum = 6.27050E+01 at iteration = 7 powll: final function value = 6.27050E+01 p.c0 56.2579 p.c1 0.11117 p.c2 -0.00119999 sherpa> uncertainty Computed for uncertainty.sigma = 1 ------------------------------------------------------------ Parameter Name Best-Fit Lower Bound Upper Bound ------------------------------------------------------------ p.c0 56.2579 -0.865564 +0.864461 p.c1 0.11117 -0.0148228 +0.0148038 p.c2 -0.00119999 -0.000189496 +0.000189222