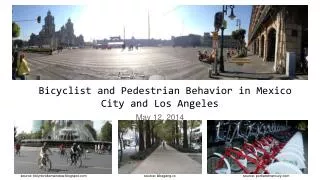
Bicyclist and Pedestrian Behavior in Mexico City and Los Angeles
This analysis explores the behavior of bicyclists and pedestrians in Mexico City and Los Angeles, highlighting key themes such as road efficiency, safety, and the impact of infrastructure on mobility. It emphasizes the necessity of measurement to manage urban transportation effectively, advocating for enhanced capacity, safety, and inclusion. Recommendations include the implementation of protected bike lanes, improved pedestrian infrastructure, and the need for balanced transportation systems. Discover how urban design influences the experience of cyclists and pedestrians in these dynamic cities.

Bicyclist and Pedestrian Behavior in Mexico City and Los Angeles
E N D
Presentation Transcript
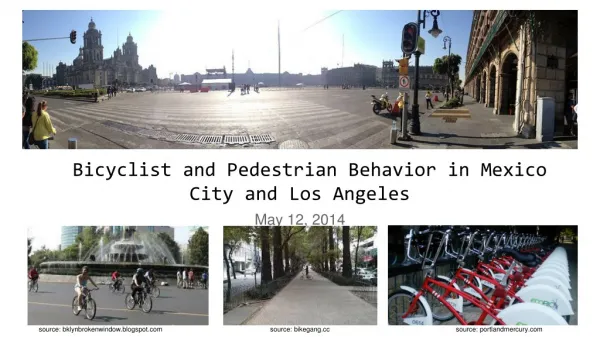
Bicyclist and Pedestrian Behavior in Mexico City and Los Angeles May 12, 2014 source: bklynbrokenwindow.blogspot.com source: bikegang.cc source: portlandmercury.com
Overview Measuring Road Efficiency Mexico City Video Pedestrian and Bicycle Infrastructure Discussion Recommendations & Los Angeles Video Conclusion
Key Themes • “You manage what you measure” • Three priorities: • Capacity • Safety • Inclusion
Level of Service (LOS): • Focus on congestion mitigation • Auto-centric • But is congestion such a bad thing? • Decreased severity and number of collisions • Rationing an over-utilized public good (Downs) • reflects social and economic vitality (Taylor) Source: clarkesvillesmartgrowth.com
What do cyclists and pedestrians like? Let’s travel to Mexico City to find out!
What do Pedestrians want? • Congestion! • shorter crossing distances • preponderance of shops • proximity to transit, bikeshare, green space
What do cyclists want? • better infrastructure • streets with less automobile traffic • proximity to transit, bikeshare, green space
Los Angeles Bike Plan Implementation Miles of Bike Infrastructure Installed
Recommendations: • Implement Protected Bike Lanes • Follow incremental Bike-share model • Re-allocate underutilized road space to pedestrians • Have more public events Source: losangeleswalks.org Source: latimesblog.latimes.com Source: inhabitat.com
Conclusion • City needs to measure what it manages • Need to have a more balanced transportation system • Separate infrastructure when possible • Optimism
Thank you! Dustin Foster, MPP* dustin.foster@lacity.org
Capacity 20-24000 people at 60 MPH (I-405)
Safety: bike and ped collisions -1,000 randomly selected collisions -also compare 5-10 streets based on capacity (lanes, speed limits)
Are Streets Places of Exclusion or Inclusion? Mode Share, Google maps screen shots
Bicycle Infrastructure Comparison: Bike Lanes implemented index (2010-2014): • M*S M= Miles of Bike Lanes Implemented in 5 years S= (% Reduction in Collisions) Mexico City: 30.6*(?) Los Angeles: