Download
1 / 32
320 likes | 349 Vues
Obtaining diversity and abundance from OBIS database – the way forward. Simon Claus & Klaas Deneudt Flanders Marine Institute (VLIZ). Outline Presentation. Introduction – Common biodiversity measurements & indices – How to model biodiversity

E N D
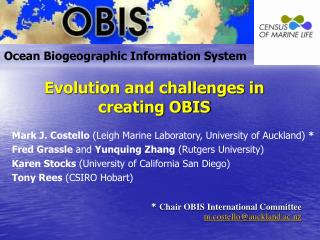
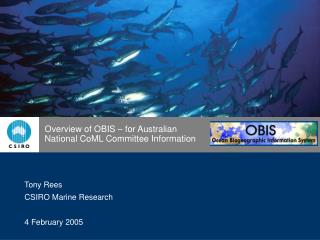
Obtaining diversity and abundance from OBIS database – the way forward Simon Claus & Klaas Deneudt Flanders Marine Institute (VLIZ)
Outline Presentation • Introduction – Common biodiversity measurements & indices – How to model biodiversity • EurOBIS and OBIS (Ocean Biogeographic Information System) – Data scheme – Data content – Quality control 3. Applications OBIS data – Global patterns of marine biodiversity (Tittensor et al, 2010 – Nature) 4. EMODnet data products – Outcomes products from Biological data product workshop – Visualisation abundance CPR data on EMODnet portal 5. Conclusions & way forward
Biodiversity measurements (1) • Occurrence or presence/absence (or not detected) • When is a species absent? • Absolute abundance or counts • Total number of animals sampled, seen or counted Positive: sample size is known Negative: not “as is” comparable between different sites or samples • Relative abundance or density • Number of animals per surface, volume • Derived from absolute abundance Negative: Size of sample is unknown => limits possibilities for correct application of statistics and indices Positive: comparable between different sites • Biomass • Productivity
Biodiversity indices (2) • Species richness indices: Species richness is a measure for the total number of the species in a community • Evenness indices: Evenness expresses how evenly the individuals in a community are distributed among the different species • Taxonomic indices: These indices take into account the taxonomic relation between different organisms in a community
Biodiversity indices(2) • Examples of Biodiversity indices: • Species richness S • Simpson index • Shannon index • Hill Numbers • Hulrbert index • Taxonomic distinctness • ... http://www.coastalwiki.org/coastalwiki/Measurements_of_biodiversity
Modelling biodiversity • Habitat suitability modelling Delineating suitable area’s (likeliness of occurrence/absence) for certain species or communities based on the environmental requirements of these species or communities • Predictions: environmental envelope modellingBased on describing the environment encompassing the current distribution of a species or ecosystem (the environmentalenvelope), then mapping the location of this same envelope under a climate change scenario. • Predicting biodiversity indices • Predictability of marine nematode biodiversity (Merckxet al, 2009 - Ecological Modelling) • Predict biodiversity indices using Artifical Neural Networks ( a data driven modeling technique used in ecological sciences as a tool for uncovering complex patterns in data)
EurOBIS and OBIS – data scheme • OBIS is a distributed system to integrate marine biogeographic information • The OBIS schema is an extension to the Darwin Core Version 2 standard • 74 fields of which 6 requiered • Four fields to describe abundance/biomass • Link to metadata record which ISO 19115 Compliant • Link to World Register of Marine Species for taxonomy
EurOBIS datacontent EMODnet In total 13,601812 dr In total 2,024359 abundance (14,8%) mainly benthic data In total 67080 biomass (0.5%)
EurOBIS quality control • Taxonomy important, even crucial (WorMS) • Integrate datasets • correct estimates of biodiversity -> (Vandepitte et al, 2009 - Hydrobiology) …In total, 6,172 unique taxon names were submitted to LargeNet. After a thorough quality control, however, this number was reduced to 4,525, mostly due to spelling variations and synonymy. Such quality control is highly needed, since a misspelled or obsolete name could be compared to the introduction of a rare species, with adverse effects on further (biodiversity) calculations. • Quality flags completeness of records • Quality procedures for biological data (sampling methods)
EurOBIS data scheme & content: issues • EurOBIS can store abundance/biomass data • However number of fields rather limited to capture these data • How to store information on fractions (meiobenthos,phytoplankton...) – not linked to WoRMS ID • Link to additional metadata is important (with ISO 19115 compliant) • Link to WoRMS is key in order to compare datasets • Number of abundance/biomass data very limited • Not requiered (find the good trade off) • Not willing to provide the data (data protection)? • Not aware of possibilities to store the data in EurOBIS format • More labour intensive to provide absence/biomass data • More difficult to provide absence/biomass data
Applications OBIS data • Global patterns and predictors of marine biodiversity across taxa (Tittensor et al, 2010 – Nature) • examine global patterns and predictors of species richness across 13 major species groups • For coastal fish: based on OBIS data
Applications OBIS data • SST only statistical factor significant. Support to thekinetic energy or temperature hypothesis, that is, that higher metabolic rates or relaxed thermal constraints promotediversity. • Endothermic groups (cetaceans and pinnipeds)showed stronger positiverelationships with primary productivity than SST
Applications OBIS data • Hotspots for both oceanicand coastal species occurred in areas with medium or higher human impact • Such overlapping hotspots of species richness and human impact should be further assessed and may be an important focus for marine management and conservation efforts across taxa
Applications OBIS data Gaps • Limited to taxa for which sufficient records were accessible to determine global distribution (cells with less then 10 years of sampling removed) • Distribution of deep-sea diversity, where data remain scarce • Limited marine invertebrate data • Microbes or viruses not considered
EMODnet data productsOutcomes products from Biological data product workshop • Biological Data Products Workshop (25-26/02/2010) Aim: • To define a set of derived data products relevant for private bodies, public authorities and researchers • Discuss the marine biological (monitoring) data availability in Europe and gaps • Present protoype portal to wide(r) community of European Biological Experts and capture feedback
EMODnet data productsOutcomes products from Biological data product workshop EMODnet • Biological Data Products Workshop (Participants) • MARE, DG Research, OSPAR, ICES, HELCOM, Black Sea Commission, coordinators of the other lots, project partners and advisory board • Greece, France, UK, Italy, Belgium, Netherlands, Germany, Sweden, Ireland, Russia, Ukraine, US, New Zealand
EMODnet data productsOutcomes products from Biological data product workshop • Workshop report available • Data products: • Species attributes (labelling) (functional groups, HAB’s, invasive species, red list or protected species, BD and HD) • Species distribution maps and trends • Species sensitivity and vulnerability map • Biodiversity indices
EMODnet data productsExample: Visualisation abundance CPR data on EMODnet portal CPR time series Copepod abundance annual anomlies per CPR grid A zooplankton time-series can be presented as a series of log-scale anomalies relative to the long-term average of these data Reveal interannual variability and trends in the time-series
EMODnet data productsExample: Visualisation abundance CPR data on EMODnet portal
EMODnet data productsExample: Visualisation abundance CPR data on EMODnet portal
EMODnet data productsExample: Visualisation abundance CPR data on EMODnet portal
EMODnet data productsExample: Visualisation abundance CPR data on EMODnet portal
EMODnet data productsExample: Visualisation abundance CPR data on EMODnet portal
EMODnet data productsExample: Visualisation abundance CPR data on EMODnet portal
EMODnet data productsExample: Visualisation abundance CPR data on EMODnet portal
Conclusions & way forward • Model & predict distributions & biodiversity: emerging area • OBIS scheme can handle most biodiversity measurment data but could be improved • Abundance data at the moment underrepresented • Quality control is key aspect – especially taxonomic qc • EMODet Biological project making first steps on identification and visualisation of biological dataproducts (indices, anomalies...) • Other types of biological data: biometry, stomach analyses, genes (growing importance, possibly future projects with that focus)
Thank youReferencesDerek P. Tittensor, Camilo Mora, Walter Jetz, Heike K. Lotze, Daniel Ricard, Edward Vanden Berghe& Boris Worm Global patterns and predictors of marine biodiversity across taxa, Nature 2010 doi:10.1038/nature09329 Merckx Bea , Peter Goethals, Maaike Steyaert, Ann Vanreusel, Magda Vincx, Jan Vanaverbeke Predictability of marine nematode biodiversity, Ecological Modelling 220 (2009) 1449–1458O’Brien, T. D., López-Urrutia, A., Wiebe, P. H., and Hay, S. (Eds). 2008. ICES Zooplankton Status Report 2006/2007http://www.coastalwiki.org/coastalwiki/Measurements_of_biodiversity