Download
1 / 32
360 likes | 698 Vues
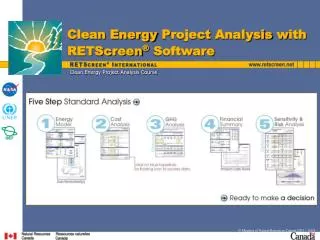
Clean Energy Project Analysis Course. Clean Energy P roject Analysis w ith RETScreen ® Software. © Minister of Natural Resources Canada 2001 – 2004 . Objectives. Illustrate role of preliminary feasibility studies Demonstrate how the RETScreen ® Software works

E N D
Clean Energy Project Analysis Course Clean Energy Project Analysiswith RETScreen® Software © Minister of Natural Resources Canada 2001 – 2004.
Objectives • Illustrate role of preliminaryfeasibility studies • Demonstrate how the RETScreen® Software works • Show how RETScreen® makes it easier to help identify & assess potential projects © Minister of Natural Resources Canada 2001 – 2004.
Energy Project Implementation Process Pre-feasibility Analysis Feasibility Analysis Development & Engineering Significant barrier Clean Energy projects not being routinely considered up-front! Construction & Commissioning © Minister of Natural Resources Canada 2001 – 2004.
Questions • What is an acceptable level of accuracy for project cost estimates? • How much do these studies typically cost? © Minister of Natural Resources Canada 2001 – 2004.
$100 to $1,000,000! Accuracy vs. Investment Cost Dilemma
Pre-feasibility Analysis Feasibility Analysis Preliminary feasibility studies When should clean energy technologiesbe assessed? • Need for energy system • New construction or planned renovation • High conventional energy costs • Interest by key stakeholders • Approvals possible • Funding & financing accessible • Good local clean energy resource, etc. © Minister of Natural Resources Canada 2001 – 2004.
Project Viability (Wind Example)Depends on Several Factors • Energy resource available at project site (e.g. wind speed) • Equipment performance (e.g. wind turbine power curve) • Initial project costs (e.g. wind turbines, towers, engineering) • “Base case” credits (e.g. diesel generators for remote sites) • On-going and periodic project costs (e.g. cleaning of wind turbine blades) Wind Turbine & Tower © Minister of Natural Resources Canada 2001 – 2004.
Project Viability (Wind Example)Depends on Several Factors - cont. • Avoided cost of energy (e.g. wholesale electricity price) • Financing (e.g. debt ratio & length, interest rate) • Taxes on equipment & income(or savings) • Environmental characteristics of energy displaced (e.g. coal, natural gas, oil, large hydro, nuclear) • Environmental credits and/or subsidies (e.g. greenpower rates, GHG credits, grants) • Decision-maker’s definition of cost-effective (e.g. payback period, IRR, NPV, Energy production costs) Wind Energy Photo Credit: Middelgrunden Wind Turbine Co-operative © Minister of Natural Resources Canada 2001 – 2004.
Why Use RETScreen®? • Simplifies preliminary evaluations • Requires relatively little user input • Calculates key technical and financial viability indicators automatically • Costs 1/10th the amount of other assessment methods • Standardized procedures allow objective comparisons • Increases potential for successful clean energy project implementation © Minister of Natural Resources Canada 2001 – 2004.
Comparing PV Energy Production Calculated by RETScreen and HOMER RETScreen® Validation- Examples • All models validated by comparison with monitored and manufacturer’s data… 100% Manufacturer 80% RETScreen 60% Efficiency (%) 40% Hydro Turbine Efficiency Curves: 20% RETScreen vs. Manufacturer 0% 0% 20% 40% 60% 80% 100% Percent of Rated Flow • … and/or by comparison with hourly simulation tools. © Minister of Natural Resources Canada 2001 – 2004.
RETScreen®Software Demonstration(Wind Energy Project Model Example)
white yellow blue grey Cell Colour Coding © Minister of Natural Resources Canada 2001 – 2004.
Comparison: Base Case vs. Proposed Case Conventional system vs. clean energy system Example: Standard building cladding (siding) and a natural gas fired air heater vs. Solarwall™cladding with solar air heating plus the conventional natural gas fired air heater RETScreen® SoftwareFinancial Analysis Method Yellowknife School Solarwall Under Construction Photo Credit: Arctic Energy Alliance © Minister of Natural Resources Canada 2001 – 2004.
Input/Output (RETScreen®) Project location: Wind speed: GHG emissions reduction: Wind turbine cost: RE production credit: GHG credit (coal plant): Debt term: Positive cash flow: Return on investment: Software Demo20 MW Wind Energy Project Scenario #1 (Merchant Plant) • Calgary, AB • 4.4 m/s • 25,123 tCO2/yr • $1,200/kW • $0/kWh • $0/ton • 10 years • 42.7 years • - 7.1% Scenario # 2 (Green Power Plant) • Pincher Creek, AB • Lethbridge 7.0 m/s • 63,486 tCO2/yr • $1,000/kW • $0.025/kWh • $5/ton • 15 years • 5.2 years • 22.8% © Minister of Natural Resources Canada 2001 – 2004.
Scenario #1 (Merchant Plant) Calgary, AB 4.4 m/s $1,200/kW 25,123 tCO2/yr $0/kWh $0/ton 10 years 42.7 years - 7.1% Software DemoScenario 1 © Minister of Natural Resources Canada 2001 – 2004.
Scenario # 1a (Green Power Plant) Pincher Creek, AB Lethbridge 7.0 m/s 63,486 tCO2/yr 18.2 years 4.8% Software DemoWind Speed & GHG Emission Reduction © Minister of Natural Resources Canada 2001 – 2004.
Scenario # 1b $1,000/kW 16.5 years 6.5% Software DemoWind Turbine Cost © Minister of Natural Resources Canada 2001 – 2004.
Scenario # 1c $0.025/kWh 10.1 years 17.7% Software Demo RE Production Credit © Minister of Natural Resources Canada 2001 – 2004.
Scenario # 1d $5/ton 7.5 years 20.1% Software DemoGHG Emissions Credit © Minister of Natural Resources Canada 2001 – 2004.
Scenario # 2 15 years 5.2 years 22.8% Software DemoDebt Term © Minister of Natural Resources Canada 2001 – 2004.
Questions? Clean Energy Project Analysis with RETScreen® Software Module RETScreen® International Clean Energy Project Analysis Course For further information please visit the RETScreen Website at www.retscreen.net © Minister of Natural Resources Canada 2001 – 2004.