Oligopoly Chapter 9
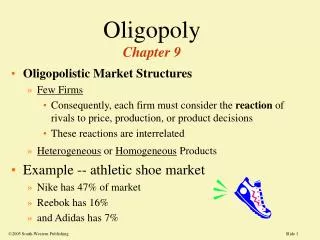
Oligopoly Chapter 9. Oligopolistic Market Structures Few Firms Consequently, each firm must consider the reaction of rivals to price, production, or product decisions These reactions are interrelated Heterogeneous or Homogeneous Products Example -- athletic shoe market

Oligopoly Chapter 9
E N D
Presentation Transcript
Oligopoly Chapter 9 • Oligopolistic Market Structures • Few Firms • Consequently, each firm must consider the reaction of rivals to price, production, or product decisions • These reactions are interrelated • Heterogeneous or Homogeneous Products • Example -- athletic shoe market • Nike has 47% of market • Reebok has 16% • and Adidas has 7% 2005 South-Western Publishing
Nokia’s Challenge in Cell Phones • The market shares of oligopolists change. In 1998, the market leader in cell phones was Motorola with 25% market share and Nokia second with 20% • In 2002, leadership reversed: Nokia held 37% of the market and Motorola 17% • However, technology in phones is changing, bringing wireless web, photos, and other high-speed G3 technologies • Entry of other firms and new products, such as Dell, Palm, NEC and Panasonic pose threats to Nokia’s profit margins • Nokia must decide whether or not to invest heavily in the 3G technology for the future. • Being a leader in a oligopoly does not mean that you remain the leader for long.
Ignoring Interdependencies: The Cournot Oligopoly Models vary depending on assumptions of actions of rivalsto pricing and output decisions. Augustin Cournot(1838) created a model that is the basis of Anti-trust Policy in the US. Relatively simple assumption: ignore the interdependency with rivals This makes the math easy Cournot
IN COMPETITION P = MC, so 950 - Q = 50 PC = $50 and QM = 900 IN MONOPOLY MR = MC, so 950 -2Q = 50 QM = 450 so PM = 950 - 450 = $500 IN DUOPOLY Let Q = q1 + q2 A Numerical Example:Competition, Monopoly, and Cournot Oligopoly Let:P = 950 - Q andMC =50 $500 PM Pcournot PC $350 $50 D QMQCournot QC 450 600 900
Assume each firm maximizes profit Assume each firm believes the other will NOT change output as they change output. The so-called: Cournot Assumption Find where each firm sets MR = MC Cournot Solution: Case of 2 Firms (Duopoly)
Let Q = q1 + q2 • P = 950 - Q = 950 - q1- q2and MC = 50 • TR1= Pq1= (950-q1-q2)q1=950q1 - q12 - q1q2and • TR2= Pq2= (950-q1-q2)q2=950q2 - q2q1 - q22 • SetMR1= MC & MR2= MC • 950 -2q1 - q2 = 50 • 950 - q1 - 2q2 = 50 2 equations & 2 unknowns
With 2 Equations & 2 Unknowns: Solve for Output 950 -2q1 - q2 = 950 - q1 - 2q2 So, q2 = q1 Then plug this into the demand equation we find: 950 - 2q1 - q1 = 950 - 3q1 = 50. Thereforeq1=300and Q =600 The price is: P = 950 - 600 =$350 P Q Cournot’s answer is between the other two. Competition 50 900 Cournot 350 600 Monopoly 500 450
N-Firm Cournot Model • For 3 firms with linear demand and cost functions: • Q = q 1 + q 2 + q 3 • In linear demand and cost models, the solution is higher output and lower price QCournot = { N / (N+1) }QCompetition QC N THEREFORE, Increasing the Number of Firmsincreases competition. This is the historical basis for Anti-trust Policies PC N
If N = 3 Triopoly P = 950 - Q & MC=50 Then, Q = (3/4)(900) Q = 675 P =$275 If N = 5 P = 950 - Q and MC = 50 Then Q = (5/6)(900) Q = 750 P = $200 Example:Cournot as N Increases N = 3 N = 5
Collusion versus Competition? • Sometimes collusion succeeds • Sometimes forces of competition win out over collective action • When will collusion tend to succeed? • There are six factors that influence successful collusion as follows:
Factors Affecting Likelihood of Successful Collusion 1. Number and Size Distribution of Sellers. Collusion is more successful with few firms or if there exists a dominant firm. 2. Product Heterogeneity.Collusion is more successful with products that are standardized or homogeneous 3. Cost Structures. Collusion is more successful when the costs are similar for all of the firms in the oligopoly. 4. Size and Frequency of Orders. Collusion is more successful with small, frequent orders. • Secrecy and Retaliation. Collusion is more successful when it is difficult to give secret price concessions. 6. Percentage of External Orders. Collusion is more successful when percentage of orders outside of the cartel is small.
When there are just a few firms, profits are enhanced if all reduce output But each firm has incentives to “cheat” by selling more Oligopolies & Incentives to Collude MC MC P D incentive to cut price q MR QM Representative firm Industry
Examples of Cartels • Ocean Shipping -- maritime exemption from US Antitrust Laws • DeBeers -- diamonds • 1950’s Electrical Pricing Conspiracy -- GE, Westinghouse, and Allis Chalmers • OPEC - oil cartel, with Saudi Arabia making up 33% of the group’s exports • Siemens and Thompson-CSF-- airport radar systems • NCAA - intercollegiate sports, also Major League Baseball
PRICE LEADERSHIP • Barometric: One (or a few firms) sets the price • One firm is unusually aware of changes in cost or demand conditions • The barometer firm senses changes first, or is the first to ANNOUNCE changes in its price list • Find barometric price leader when the conditions unsuitable to collusion & firm has good forecasting abilities or good management
Barometric Price Leader Example: Citibank & Prime Rate Announcements • Banking: 6,000 banks and falling, but there are still many banks. • New York, center of Open Market activities of the Fed Reserve • Citibank’s announcement represents changes in interest rate conditions to other banks tolerably well.
Dominant Firm Price Leadership MC F • Dominant Firm: 40% share of market or more. • No price or quantity collusion • Dominant Firm (L) expects the other firms (F) to follow its price and produce whereMC F = PL DT DL leader’s demand Net Demand Curve: DL = DT - MCF
Graphical Approach to Dominant Firm Price Leadership MC F • Find leader’s demand curve, DL = (DT - MC F) • Find where MRL = MCL DL DT MRL
Graphical Approach to Dominant Firm Price Leadership MC F • At QL, find the leader’s price, PL • Followers will supply the remainder of Demand: (QT - QL) = QF MCL PL DL D MRL QL
Graphical Approach to Dominant Firm Price Leadership MC F • Followers will supply the remainder of Demand: (QT - QL) = QF MCL PL DL D MRL QL QT
Implications of Dominant Firm Price Leadership • Market Share of the Dominant Firm Declines Over Time • Entry expands MC F, and Shrinks DL and MRL • Profitability of the Dominant Firm Declines Over Time • Market Share of the Dominant Firm is PROCYCLICAL • rises in booms, declines in recessions profits TIME
Numerical Example of Dominant Firm Price Leadership Aerotek is the leader, with 6 other firms, given the following: • P = 10,000 – 10 QT is the market demand • QT = QL + QF is the sum of leader & followers • MCL = 100 + 3 QL and SMCF = 50 + 2 QF What is Aerotek’s price and quantity? • From 2 above, QL = QT – QF and From 1, QT = 1,000 - .1P • Since followers sell at P=MC, From 3, P = 50 + 2 QF, which rearranged to be QF = .5P - 25 • So, QL = (1,000 - .1P) – (.5P - 25) = 1,025 -.6 P, which can be rearranged to be P = 1,708.3 – 1.67 QL • MRL = 1,708.3 – 3.34 QL • And MRL = MCL where: 1,708.3 – 3.34 QL = 100 + 3 QL • The optimal quantity for Aerotek, the leader is QL254 • P = 1,708.3 – 1.67 QL = 1,708.3 – 1.67(254) $1,284.
Historical Example:U.S. Steel (USX) profits in a dominant firm model profits when using a lower price • In early 1901 negotiations among J. P. Morgan, Elbert Gary, Andrew Carnegie, and Charles M. Schwab created United States Steel. • 66% market share in 1901 • 46% market share by 1920 • 42% share by 1925 normal profits Time Coke ovens in. 1912 in Gary, IN
Kinked Oligopoly Demand Curve • Belief in price rigidity founded on experience of the great depression • Price cuts lead to everyone following • highly inelastic • Price increases, no one follows • highly elastic no one follows a price increase P everyone follows price cuts a kink at the price
A Kink Leads to Breaks in the MR Curve P • Although MC rises, the optimal price remains constant • Expect to find price rigidity in markets with kinked demand • QUESTION: • Where would we more likely find KINKS and where NOT? D MC2 MC1 D MR
The GREATER the number of firms, likely more kinked Prices Likely More Rigid The more HOMOGENEOUS, likely more kinked Prices More Rigid Which industries are likely to have kinks and which have no kinks? N = 2 heterogeneous N = 10 homogeneous
Oligopolies with few firms were more rigid in FACT Oligopolies with homogeneous products were MORE rigid in FACT Empirical Evidence vs. Predictions of the Model FACT 2 FACT 2 prediction prediction heterogeneous homogeneous N
Are these Empirical Findings Surprising? • A kink is a barrier to profitability • Firms are in business to make profits and avoid “barriers.” • Simple Alternative Explanations Exist: • More firms are more competitive • More homogenous products act more competitively • Collusion leads firms to fix prices. The rigid prices seen in oligopolies are signs of collusion.
Price Rigidities and Employment Impacts • Price rigidity will make business downturns worse • Employment will be more volatile over the business cycle if there are price rigidities if price changes with shifts in demand A rigid price D BOOMS D BUSTS OUTPUT Q3 Q2 Q1
Oligopolistic Rivalry & Game Theory • John Von Neuman & Oskar Morgenstern-- • Game Theory used to describe situations where individuals or organizations have conflicting objectives • Examples: Pricing of a few firms, Strategic Arms Race, Advertising plans for a few firms, Output decisions of an oligopoly • Strategy--is a course of action • The PAYOFF is the outcome of the strategy. • Listing of PAYOFFS appear in a payoff matrix. • A Strategy Game – involves decisions with consciously interdependent behavior of two or more participants.
Each player knows his and opponent’s alternatives Preferences of all players are known Single period game Each player can invade the territory of the other (Maraude) or Guard his own territory Kahn’s payoff is given first, Randle’s payoff is second. Randle ranks Guard above Maraude. Randle has a Dominant Strategy: a decision that maximizes welfare independent of the other player’s strategy choice Knowing what Randle will do, Kahn decides to Guard as well. An Equilibrium--none of the participants can improve their payoff Two Person GameTable 12. 4 page 537 ASSUMPTIONS Randle Guard Maraude Better, 1st Worst, 4th Guard Kahn Maraude Worse,2ndBest, 3rd We will get to {Guard, Guard} which is an Equilibrium
Six or Seven Territories?Table 12.5 on page 538 Sharp • Sharp and Xerox compete in copiers. Payoffs for Xerox are in the lower triangle • The payoffs depend on the number of territories in which they compete • Sharp has a dominant strategy of 6 territories. • What should Xerox do? • We see we get to {6, 6} as the iterated dominate strategy. 6 territories 7 territories 6 territories 7 territories $40 $70 $35 $55 $30 $60 $45 $45 Xerox
Other Strategic Games • These are viewed as single period, but businesses tend to be on-going, or multi-period games • These are two-person games, but oligopolies often represent N-person games, where N is greater than 2 • Some games are zero-sum games in that what one player wins, the other player loses, like a game of poker • Other games are non-zero sum games where the whole payoffs depend on strategy choices by all players.
Often the payoffs vary depending on the strategy choices The Prisoner’s Dilemma Two suspects are caught & held separately Their strategies are either to Confess (C) or Not Confess (NC) a one period game Suspect 1 in lower triangle (Bold Red) Noncooperative Solution both confess: {C, C} Cooperative Solution both do not confess {NC,NC} Off-diagonal represent a Double Cross The Prisoner’s Dilemma suspect 2 NC C 1 yr 0 yrs NC C 1 yr 15 yrs suspect 1 15 yrs 6 yrs 0 yrs 6 yrs
Paradox? • The Prisoner’s Dilemma highlights the situation where both parties would be best off it the cooperated • But the logic of their situation ends up with a non-cooperative solution • The solution to cooperation appears to be transforming a one-period game into a multi-period game. • The actions you take now will then have consequences in future periods.