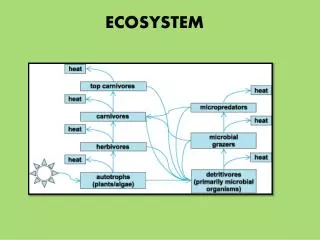
Ecosystem component
Ecosystem component. Levi, Finland 13-18 November. Site representativeness. 5 yearrs plan O1.1.4 To provide an optimal design for an operational long term system for monitoring the carbon balance of Europe and of European countries.

Ecosystem component
E N D
Presentation Transcript
Ecosystem component Levi, Finland 13-18 November
Site representativeness • 5 yearrs plan • O1.1.4 To provide an optimal design for an operational long term system for monitoring the carbon balance of Europe and of European countries. • Task 1.1.4 Contribution to develop the CarboEurope carbon observation system through optimisation of the flux network A comprehensive scientific analysis using multivariate statistical analysis and optimisation theory will be carried out to assess the current distribution of flux sites and to redesign the spatial distribution of sampling in terms of ecosystem, climate, soils and management regimes. A new European design of the flux network will be provided taken into account the modelling needs and the representativeness of ecosystems. This result could be used in the future for implementation of an operational carbon data observation system at European level.
Site representativeness • 18-months plan • Task 1.1.4 Assessment of ecosystem site network • It is planned to generate a comprehensive scientific analysis using multivariate statistical analysis and optimisation theory to assess the current distribution of flux sites and to redesign the spatial distribution of sampling in terms of ecosystem, climate, soils and management regimes. This analysis will occur within the first two years. The results of the analysis could be in maintaining some of the stations but a reallocation of the existing network in undersampled areas or specific ecosystems of particular relevance will be considered. This result could be used in the future for implementation of an operational carbon data observation system at European level.
16 Clusters of sites (different land uses/covers) Total 103 sites of ecosystem fluxes Continuous monitoring (51 sites for 5 years) EDDY FLUX CarboEurope – IP 103 Eddy covariance sites 50 forests 28 grasslands 22 crops 3 others Useful data for parametrization / validation Standardized quality control and gap-filling Centralized database with standard, fully transparent data processing
Summary 1 Flux towers are not used for geospatial scaling of carbon fluxes but to improve current models estimate and process level understanding. What is the optimal design of the flux network ? How many sites are needed to reduce model uncertainties by x %. Use Baysean approach, Montecarlo tools (learn from inversion community, Rayner work). Include land use, disturbances. Perform a sectorial analysis
1.8 1.6 Updating MODIS GPP algorithm parameters Keyp. RUEmax: 1.4 1.2 1 RUE [gC / MJ APAR] 0.8 0.6 • inter-PFT variability • intra-PFT variability • f(species, N, T???) 0.4 0.2 0 ENF EBF DBF MF Sav Oshrub Crop
Summary 2 • Optimal representation of biophysical/land use patterns. Multi-layer approach based on European data sets. Extract information to expand biophysical features with land use patterns. Use a sectorial approach (grassland, cropland, forests)
Summary • At the moment we are not able to provide a solid scientific rationale for an optimal network design, work must proceed (workshop in March, Italy) with also other components input (atmosphere, modellers) BUT……..
Efficiency of network design • Revisit scientific questions • Classify current network design according to scientific questions (mapping sites to questions) • Verify if the current sites are fulfilling the objectives • Verify the suitability of sites (eddy problem) • Verify the data delivery of sites (administrative)
RULES FOR DATA SUBMISSION(to be accepted by all components) • End of December (31.12.2005) all the main site data files (flux ,meteo and gen files) until June 30th 2005 must be delivered to the database. • IF NOT the operational budget assosiated with that particular flux tower site will not be awarded for 25 to 42 month • End of March (31.03.2006) all the main site data files (flux ,meteo and gen files) until December 31st 2005 must be delivered to the database. • IF NOT the operational budget associated with that particular flux tower site will be cancelled for 25 to 36 month
Some numbers From March 2004: • 275 users • 40 users not from Carboeurope IP • More than 230 sites/years • About 2000 sites/years downloaded Number of queries
Future • The Ameriflux and Fluxnet databases will be processed using the CarboeuropeIP standard methodology with the aim to obtain a new Marconi type dataset that will be used for new synthesis works at global scale • They will also use the same email alert system currently used in our database to inform the PIs about who downloaded their data and to do what. Also the Versioning code will be used.
In the next weeks the Greengrass database will be incorporated in the Carboeurope IP database and processed. • We asked also the data from Carbomont without answer • We are waiting the data from the Siberian projects (from Eurasia-net to TCOS) • We will try also to obtain data from the Amazonian project from EU • Any other dataset is welcome We invite also the PIs to send their data and in particular the 2003 missed months!!!
List of synthesis papers • NPP/GPP ratio for forests (Luyssaert & Matteucci) • Albedo across a European network (forests, croplands & grasslands) (Hari, Susiluuto & Grelle) • Direct and diffuse radiation response of forests (Zhang & Grace + Helsinki + Cescatti) • Phenology of C allocation and the decoupling of photosynthetic uptake from aboveground growth (Wingate & Grace + Hari) • The impact of forest thinning on carbon and water fluxes (lead author) • U* effect by night and day (Aubinet) • Temporal variability of GPP, NEP and RA over forests Luyssaert, Janssens & Moors • Rodeghiero, Cescatti, Janssens, Reichstein Modelling forest soil respiration (a comprehensive latitudinal study) • Granier et al The effect of the 2003 drought on forest ecosystem fluxes
Activity 1.6 Grasslands / Wetlands CarboEurope IP Ecosystem Component meeting Grassland/Wetland report Levi, 14-18/11 / 05
Carbon fluxes in a continuously grazed site (g C m-2 yr-1) Intensive management – FR Laqueuille 1405 Reco 1560 1217 188 11 GPP Rplant + Rsol CH4 Rani Faeces Intake 295 94 LW increase 2
Carbon fluxes in a cut grassland (CH-Oensingen) CO2 manure harvest DC/Dt
GRASSLANDSRevised integrated papersand WP for months 24-42 • (Site representativity Valentini et al.) • 6.1 Grassland flux decomposition and climate sensitivity (Gilmanov et al.) • 6.2 Grassland management effects on NBP. Simple model to be closely linked with J. Tenhunen (Vincent Allard) • 6.3 Contribution of past history, current management and climate effects for NEE, NBP and GHG balance using models (+Katja Klumpp with Pasim and Annette Freibauer with EPIC) • 6.4 Wetlands modelling with Pixgro (John Tenhunen) • 6.5 Synthesis of the grassland flux data (including the GreenGrass, Carbomont, CarboEurope sites) (J-F Soussana) All papers with sites co-authors (when data are available)
Questions to other components Integration: How to integrate sub-grid models into Eurogrid (50x50km)? Who is providing georerefernced land/use data at sub – grid scale ? Atmosphere : How to integrate concentration measurements into flux network ? How to use flux towers into tall tower design ?
IPCC AR4 Agricultural GHG Mitigation Regional estimates of the biophysical mitigation potential for all practices and GHGs together First Order Draft – do not cite or quote
IPCC AR4 Agricultural GHG Mitigation Effect of price of CO2-eq. (US$ t CO2-eq. -1) on the total global mitigation potential First Order Draft – do not cite or quote
Work Plan - months 25-42: • Collect meta-data for management – spatial (Abdn) • Collate uncertainty data (Abdn) • Compare error sources in flux data (table on instrumentation [& height] to develop into a paper on how to measure fluxes on cropland – shared experiences - Werner Eugster to co-ordinate – link to uncertainty? Stand-alone? Linked to night-time flux?) • Night-time flux – comparison with chamber measurements (Werner Eugster) • Synthesis paper to compare crop sites (add new sites) – synthesis paper (under way) • Define where sites fall on the SOC “depletion from natural” curve and compare fluxes (Werner Kutsch) • Carbon fluxes when crop is not there – all disturbances / transition periods (Enzo to coordinate) • Combined workshop (with forest and grassland / wetland activities) on how to use the flux data for modeling – (with John Tenhunen – Watti to pass on contacts to John) • Consolidated GHG balance for Europe (modelled N2O, CO2, CH4) – compare with IPCC - Abdn