Comprehensive Data Analysis and Findings for Project 50800
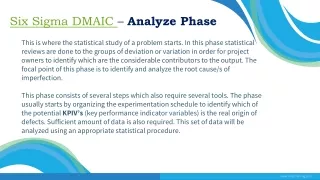
This project focuses on the analyze phase of our team’s efforts. We have completed a detailed review of the project charter and successfully captured relevant data. Utilizing tools like fishbone diagrams and cause-and-effect matrices, our analysis highlights key performance indicator variables (KPIVs) affecting key process output variables (KPOVs). The results are graphically presented to ensure clarity. We will identify the KPIVs causing significant issues and highlight them without proposing solutions at this stage. The objective is to present solid evidence for addressing critical problem areas.


Comprehensive Data Analysis and Findings for Project 50800
E N D
Presentation Transcript
TECH 50800 ProjectTitleAnalyze Phase Date: Team members:
Data Collection • Summarize data collection up to this point, either graphically or in a tabular format
TECH508 Analyze Step Complete the analyze phase for your project. - include either a fishbone diagram or cause and effect matrix - perform appropriate data analysis and include enough evidence to convincingly ‘convict’ or ‘acquit’ each of the KPIVs
Graphs • Graphically display the data
TECH508 Conclusions • What conclusions can you come to with your data analysis? • What KPIVs are causing the biggest problems with your KPOVs – how do you know? Important – do not discuss solutions at this point – this is the next phase…you simply want to convince your audience that you have thoroughly examined the issues and the contributing factors and have successfully identified the biggest problem areas using your data collection and analysis skills. This is where you want your champions to be saying “great work – we definitely need to address _________” and then you’re off and running with “improve.”