Download
1 / 13
130 likes | 336 Vues
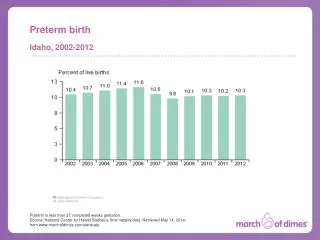
Preterm birth. Kansas, 2003-2013. Preterm is less than 37 completed weeks gestation. Source: National Center for Health Statistics, final natality data. Retrieved October 15, 2015, from www.marchofdimes.org/peristats. Preterm by maternal age. Kansas, 2011-2013 Average.

E N D
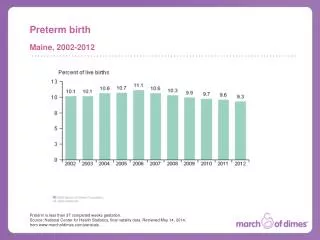
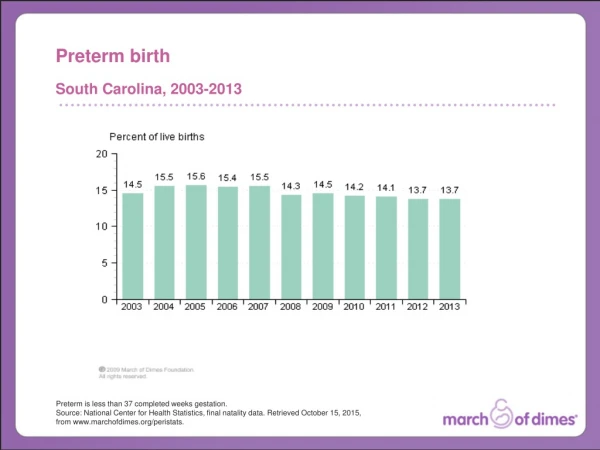
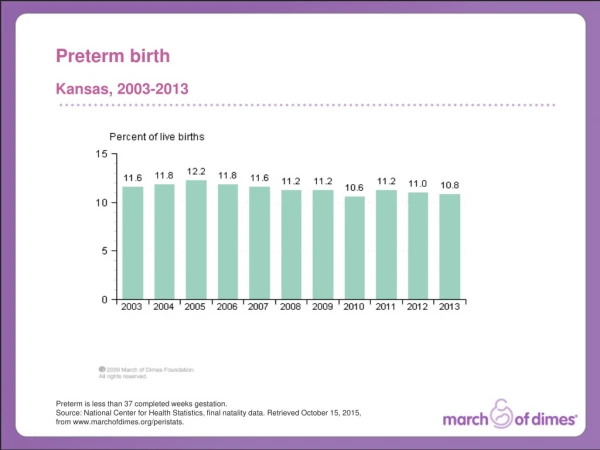
Preterm birth Kansas, 2003-2013 Preterm is less than 37 completed weeks gestation. Source: National Center for Health Statistics, final natality data. Retrieved October 15, 2015, from www.marchofdimes.org/peristats.
Preterm by maternal age Kansas, 2011-2013 Average Preterm is less than 37 completed weeks gestation. Source: National Center for Health Statistics, final natality data. Retrieved October 15, 2015, from www.marchofdimes.org/peristats.
Preterm by race/ethnicity Kansas, 2011-2013 Average All race categories exclude Hispanics. Preterm is less than 37 completed weeks gestation. Source: National Center for Health Statistics, final natality data. Retrieved October 15, 2015, from www.marchofdimes.org/peristats.
Late preterm births Kansas, 2003-2013 Late preterm is between 34 and 36 weeks gestation. Source: National Center for Health Statistics, final natality data. Retrieved October 15, 2015, from www.marchofdimes.org/peristats.
Low birthweight Kansas, 2003-2013 Low birthweight is less than 2500 grams (5 1/2 pounds). Source: National Center for Health Statistics, final natality data. Retrieved October 15, 2015, from www.marchofdimes.org/peristats.
Total cesarean deliveries Kansas, 2003-2013 Source: National Center for Health Statistics, final natality data. Retrieved October 15, 2015, from www.marchofdimes.org/peristats.
Infant mortality rates Kansas, 2003-2013 An infant death occurs within the first year of life. Source: National Center for Health Statistics, final mortality data, 1990-1994 and period linked birth/infant death data, 1995-present. Retrieved October 15, 2015, from www.marchofdimes.org/peristats.
Perinatal mortality rates Kansas, 2002-2006 Perinatal deaths include fetal deaths at 28 weeks gestation or more and infant deaths less than one week of age. Source: National Center for Health Statistics, fetal mortality data and period linked birth/infant death data. Retrieved October 15, 2015, from www.marchofdimes.org/peristats.
Late fetal mortality rates Kansas, 2002-2006 A late fetal death occurs at 28 weeks of gestation or more. Source: National Center for Health Statistics, fetal mortality data. Retrieved October 15, 2015, from www.marchofdimes.org/peristats.
Maternal mortality rates Kansas and US, 2003-2007 Average Footnotes available in notes section. Source: National Center for Health Statistics, final mortality data; National Center for Health Statistics, final natality data. Retrieved October 15, 2015, from www.marchofdimes.org/peristats.
Smoking among women of childbearing age Kansas, 2004-2014 Smoking is defined as having ever smoked 100 cigarettes in a lifetime and currently smoking everyday or some days. Percent reported is among women ages 18-44. The following states did not conduct BRFSS surveillance every year and are not included in U.S. rates for the respective years: AK(1990), AR(1990,1992), DC(1995), KS(1990,1991), HI(2004), NV(1990,1991), NJ(1990), WY(1990-1993). Source: Smoking: Behavioral Risk Factor Surveillance System. Behavioral Surveillance Branch, Centers for Disease Control and Prevention. Retrieved October 15, 2015, from www.marchofdimes.org/peristats.
Obesity among women of childbearing age Kansas, 2004-2014 The following states did not conduct BRFSS surveillance every year and are not included in U.S. rates for the respective years: AK(1990), AR(1990,1992), DC(1995), KS(1990,1991), HI(2004), NV(1990,1991), NJ(1990), WY(1990-1993). Obesity is defined as a Body Mass Index of 30 or more. Body Mass Index (BMI) is a number calculated from a person's weight and height. Percent reported is among women ages 18-44. Source: Behavioral Risk Factor Surveillance System, Centers for Disease Control and Prevention. Retrieved October 15, 2015, from www.marchofdimes.org/peristats.
Uninsured women Kansas and US, 2010-2012 Average Source: US Census Bureau. Data prepared for the March of Dimes using the Current Population Survey Annual Social and Economic Supplements. Retrieved October 15, 2015, from www.marchofdimes.org/peristats.