Download
1 / 12
130 likes | 340 Vues
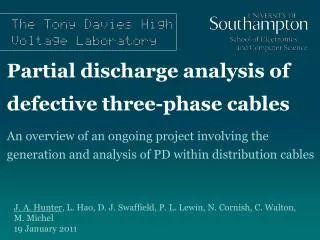
An overview of an ongoing project involving the generation and analysis of PD within distribution cables. Partial discharge analysis of defective three-phase cables. J. A. Hunter , L. Hao , D. J. Swaffield , P. L. Lewin , N. Cornish, C . Walton, M. Michel 19 January 2011 .

E N D
An overview of an ongoing project involving the generation and analysis of PD within distribution cables Partial discharge analysis of defective three-phase cables J. A. Hunter, L. Hao, D. J. Swaffield, P. L. Lewin, N. Cornish, C. Walton, M. Michel 19 January 2011
Introduction • 38 000 km of 6.6 kV and 11 kV medium voltage (MV) cables supplying London with an estimated replacement cost of £4 Billion [1] • The majority of which is of paper insulated lead covered (PILC) construction and was laid in the 60’s & 70’s • Shift in condition monitoring philosophy for these assets • Our objective - replicate “in service” conditions for a range of defective cable samples and collect PD data • Through analysis of this data, develop a better understanding of the PD phenomena associated with the failure mechanisms that effect this type of hardware [1] Matthieu Michel. ‘Comparison of off-line and on-line partial discharge MV cable mapping techniques. In Electricity Distribution’ CIRED 2005. 18th International Conference and Exhibition on, page 1
Research plan • Design an experiment that allows for safe rated voltage, current and temperature control over a three-phase cable • Fabricate a number of defective cable samples • Increase the functionality of the experiment to allow for mechanical damage to the samples • Capture PD data from a range of cable samples under rated conditions, over an extended period • Analyse the PD data looking for source specific characteristics and trends in activity over time
Cable sample design • Noise reduction of “virgin” samples • Ensure that fabrication process is the same for all samples • Representative of identified “life reducing” defects • Significant PD activity Straight lead joints containing fabrication defects that exaggerate the electrical stress within the joint
“Spike on the Ferrule” defect • Representative of poor joint construction • Asymmetric geometry – should produce identifiable PD signals • Not too severe a defect as to fail immediately 14 mm metal spike introduced during the joint fabrication process (on phase 2 pointing at phase 1)
Mechanical stress • Two mechanical tests • Test 1: Mechanical limit • Fast evolution of PD activity • Test 2: “Root compression” • Sustained pressure Mechanical crushing rig for use on joints and cable sections
Mechanical crushing test #1 • Repeated crushing using sharp bar-plane configuration • 40×3000 lb crushes • limited PD activity • Mtronix- slow evolution • Protection activation– experiment isolated. • Max. voltage = 3.5 kV after tripping • A fault occurred before a large dataset could be amassed Cable crushing in progress
Initial results • Significant PD produced by defect - isolated by increasing temperature • PD activity occurs at a specific phase angles • Cross talk is observed on the other phases • Detailed analysis of these PD pulses is required to extensively characterise them Three-phase phase resolved PD plot produced by “Spike” sample at rated temperature
Conclusions • Full recovery of failed cable sample after removal of pressure and 1.5 hrs of heating at rated temperature (65 oC) • Strong temperature relationship with PD activity for these types of cable • The peak apparent charge is in the range of nC - common in PILC cable samples at room temperature • Adding stress relief tape to sample terminations reduces the magnitude of PD produced by the cable itself
Future work • Thoroughly characterise the PD signals produced by different sources • Classification of PD signals produced by different defects using a novel feature vector and machine learning technique • Development of the crushing experiment is required • Continue to record PD activity from a range of sources • Further investigate the relationship between the various failure mechanisms that effect these types of asset and the associated PD activity