Trends in Family Health Insurance Premiums and Income Impact (2003-2020)
This report analyzes family health insurance premiums across states from 2003 to 2020, highlighting significant financial burdens on households, particularly those under 65 years of age. It reveals that a substantial portion of the population lives in regions where health premiums exceed 20% of their income. The study also details employee contributions to family coverage, average deductibles, market share of health plans, and growth rates in employer-sponsored insurance costs, providing insight into the evolving landscape of health insurance economics.


Trends in Family Health Insurance Premiums and Income Impact (2003-2020)
E N D
Presentation Transcript
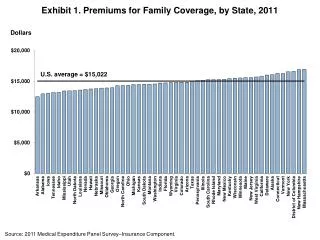
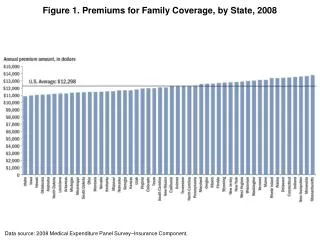
Exhibit 1. Premiums for Family Coverage, by State, 2011 Dollars U.S. average = $15,022 Source: 2011 Medical Expenditure Panel Survey–Insurance Component.
Exhibit 2. Employer Premiums as Percentage of Median Household Income for Under-65 Population, 2003 and 2011 80 percent of under-65 population live where premiums are 20 percent or more of income WA WA NH NH ME ME VT VT MT MT ND ND MN MN OR OR MA ID MA ID WI WI NY NY SD SD WY WY MI RI MI RI CT CT PA PA IA IA NJ NE NJ NE NV NV OH OH DE DE IN IN IL IL UT UT CO MD CO MD CA WV CA WV VA VA KS KS MO MO DC DC KY KY NC NC TN TN OK OK AZ AZ NM NM AR AR SC SC GA GA AL AL MS MS TX TX LA LA FL FL HI HI AK AK Less than 14% 14%–16.9% 17%–19.9% 20% or more Sources: 2003 and 2011 Medical Expenditure Panel Survey–Insurance Component (for total average premiums for employer-based health insurance plans, weighted by single and family household distribution); 2003–04 and 2011–12Current Population Surveys (for median household incomes for under-65 population).
Exhibit 3. Employee Contribution for Family Coverage, Average Annual Employee Premium Share, 2003 and 2011 Dollars per year for family coverage Source: Medical Expenditure Panel Survey–Insurance Component (employee premium share for 2003 and 2011).
Exhibit 4. Private Health Insurance Deductibles: State Averages by Firm Size and Household Type, 2003–2011 Note: Small firms = firms with fewer than 50 employees; large firms = firms with 50 or more employees. Source: Medical Expenditure Panel Survey–Insurance Component, 2003 and 2011.
Exhibit 5. Single-Person Deductibles, by State, 2011 Dollars U.S. average = $1,123 Source: 2011 Medical Expenditure Panel Survey–Insurance Component.
Exhibit 6. Total Premiums for Family Coverage, 2003, 2011, 2015, and 2020 Health insurance premiums for family coverage (dollars) * Premium estimates for 2015 and 2020 using 2003–11 historical average national growth rate. Source: Medical Expenditure Panel Survey–Insurance Component (premiums for 2003 and 2011).
Exhibit 7. Average Rebate per Family, by State, 2012 WA NH ME VT MT ND MN OR MA ID WI NY SD WY MI RI CT PA IA NJ NE NV OH DE IN IL UT MD CO CA WV VA KS DC MO KY NC TN OK AZ No rebate (2 states) NM AR SC GA AL MS Less than $125 (16 states) TX LA $125–$199 (16 states + DC) FL $200–$499 (13 states) HI $500 or more (3 states) AK Source: Authors’ analysis. Data: http://www.healthcare.gov/law/resources/reports/mlr-rebates06212012a.html.
Exhibit 8. Market Share of Three Largest Health Plans, by State, 2011 WA NH ME VT MT ND MN OR MA ID WI NY SD WY MI RI CT PA IA NJ NE NV OH DE IN IL UT MD 45%–59% (5 states) CO CA WV VA KS DC MO KY 60%–69% (17 states) NC TN OK AZ NM AR SC 70%–79% (20 states + DC) GA AL MS 80%–91% (8 states) TX LA FL HI AK Source: Authors' analysis of Managed Market Surveyor, HealthLeaders-Interstudy data on health insurance enrollment as of January 2011. Healthleaders-Interstudy. Used with Permission. All Rights Reserved.
Exhibit 9. Employer-Sponsored Insurance Costs per Enrollee Increasing Faster Than Medicare Spending per Enrollee Annual rate of growth, percent Source: CMS Office of the Actuary, National Health Expenditure Projections, 2011–2021, updated June 2012.
Exhibit 10. Projected Annual Savings in Family Premiums, 2015 and 2020 Source: Medical Expenditure Panel Survey–Insurance Component; Premium estimates for 2015 and 2020 using 2003–11 historical average national growth rate.